常使用web服务器的朋友大都了解,一般的web server有两部分日志:
一是运行中的日志,它主要记录运行的一些信息,尤其是一些异常错误日志信息
二是访问日志信息,它记录的访问的时间,IP,访问的资料等相关信息。
现在我来和大家介绍一下利用tomcat产生的访问日志数据,我们能做哪些有效的分析数据?
首先是配置tomcat访问日志数据,默认情况下访问日志没有打开,配置的方式如下:
编辑 ${catalina}/conf/server.xml文件.注:${catalina}是tomcat的安装目录
把以下的注释(<!-- -->)去掉即可。
<!--
<Valve className="org.apache.catalina.valves.AccessLogValve"
directory="logs" prefix="localhost_access_log." suffix=".txt"
pattern="common" resolveHosts="false"/>
-->
其中 directory是产生的目录 tomcat安装${catalina}作为当前目录
pattern表示日志生产的格式,common是tomcat提供的一个标准设置格式。其具体的表达式为 %h %l %u %t "%r" %s %b
但本人建议采用以下具体的配置,因为标准配置有一些重要的日志数据无法生。
%h %l %u %t "%r" %s %b %T
具体的日志产生样式说明如下(从官方文档中摘录):
* %a - Remote IP address
* %A - Local IP address
* %b - Bytes sent, excluding HTTP headers, or '-' if zero
* %B - Bytes sent, excluding HTTP headers
* %h - Remote host name (or IP address if resolveHosts is false)
* %H - Request protocol
* %l - Remote logical username from identd (always returns '-')
* %m - Request method (GET, POST, etc.)
* %p - Local port on which this request was received
* %q - Query string (prepended with a '?' if it exists)
* %r - First line of the request (method and request URI)
* %s - HTTP status code of the response
* %S - User session ID
* %t - Date and time, in Common Log Format
* %u - Remote user that was authenticated (if any), else '-'
* %U - Requested URL path
* %v - Local server name
* %D - Time taken to process the request, in millis
* %T - Time taken to process the request, in seconds
There is also support to write information from the cookie, incoming header, the Session or something else in the ServletRequest. It is modeled after the apache syntax:
* %{xxx}i for incoming headers
* %{xxx}c for a specific cookie
* %{xxx}r xxx is an attribute in the ServletRequest
* %{xxx}s xxx is an attribute in the HttpSession
现在我们回头再来看一下下面这个配置 %h %l %u %t "%r" %s %b %T 生产的访问日志数据,我们可以做哪些事?
先看一下,我们能得到的数据有:
* %h 访问的用户IP地址
* %l 访问逻辑用户名,通常返回'-'
* %u 访问验证用户名,通常返回'-'
* %t 访问日时
* %r 访问的方式(post或者是get),访问的资源和使用的http协议版本
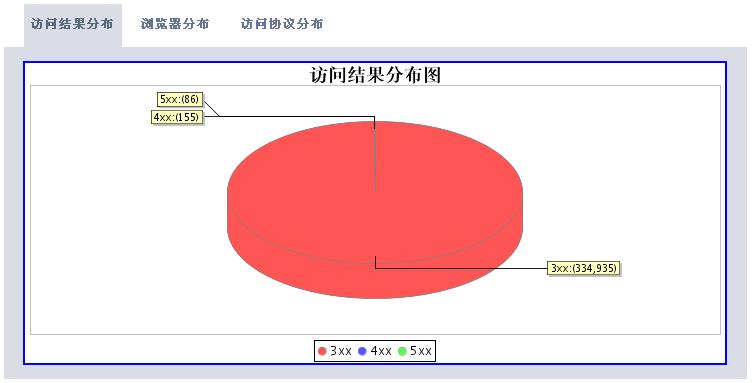
* %s 访问返回的http状态
* %b 访问资源返回的流量
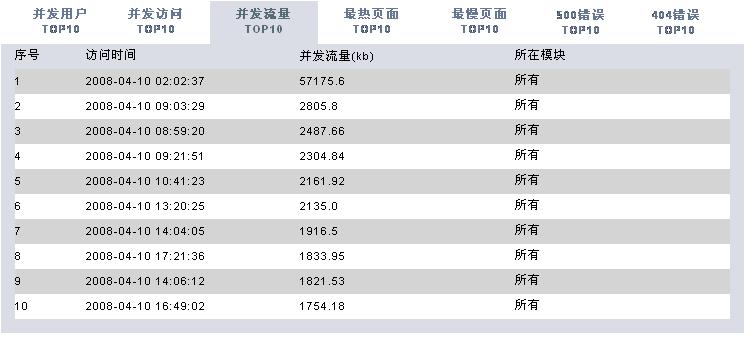
* %T 访问所使用的时间
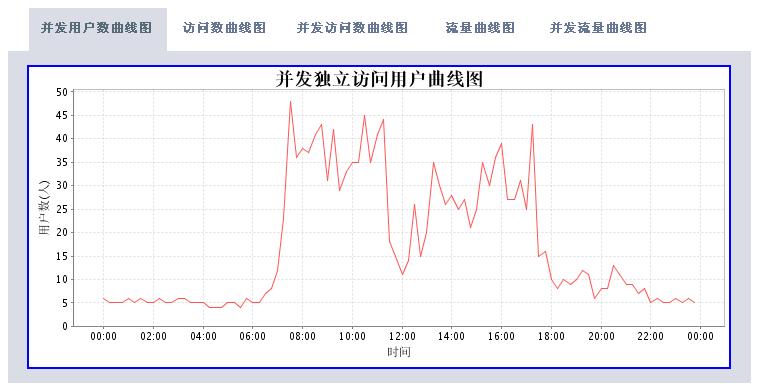
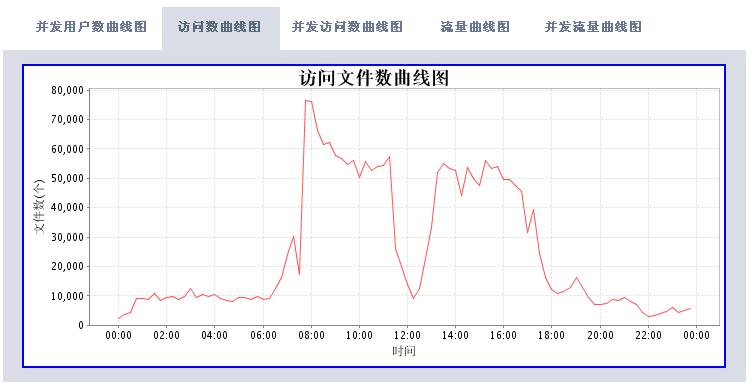
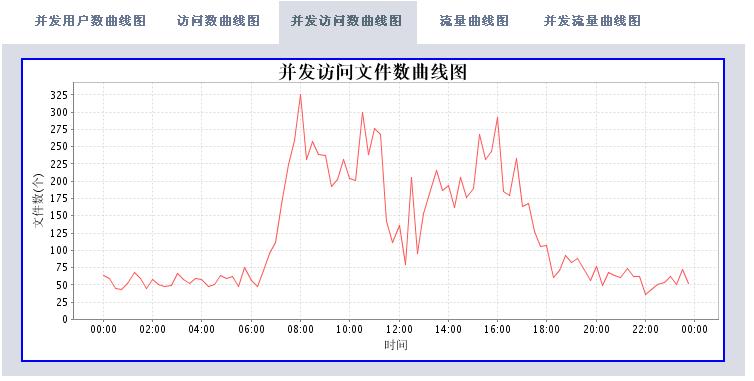
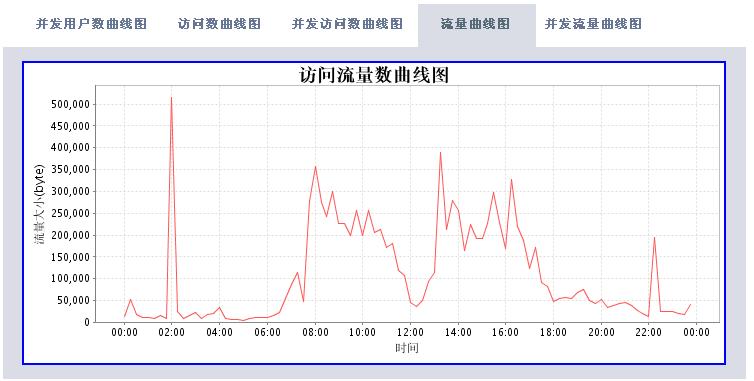
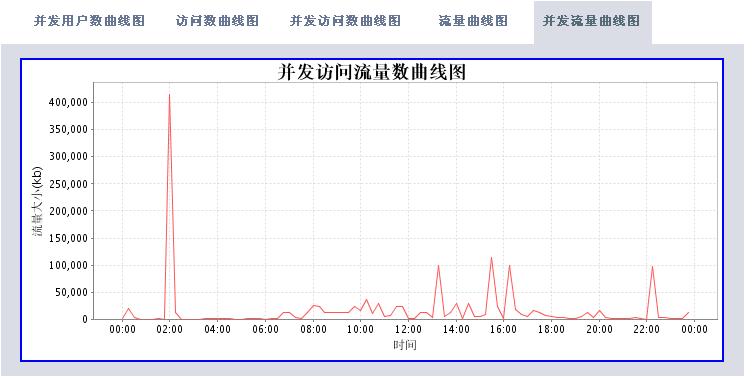
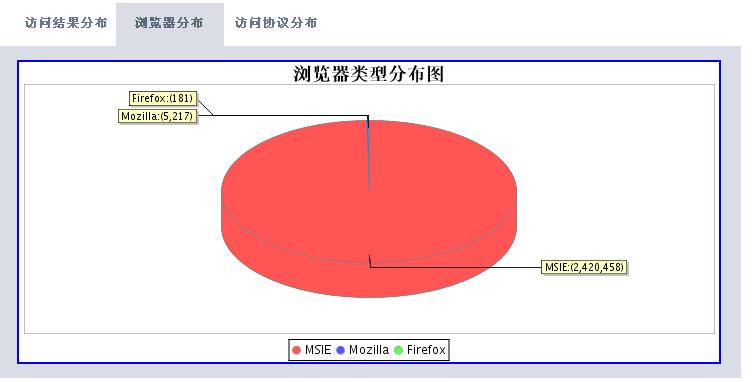
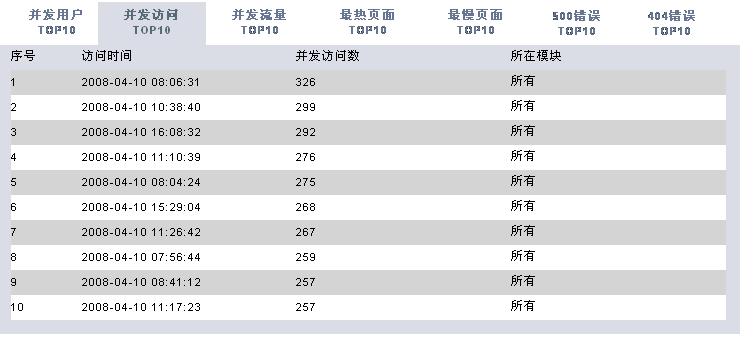
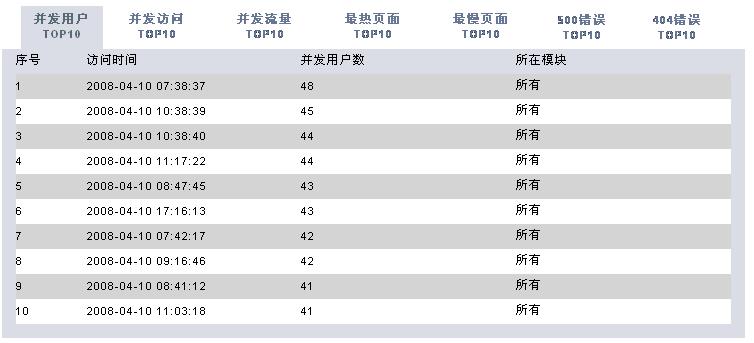
有了这些数据,我们可以根据时间段做以下的分析处理(图片使用jfreechart工具动态生成):
* 独立IP数统计
* 访问请求数统计
* 访问资料文件数统计
* 访问流量统计
* 访问处理响应时间统计
* 统计所有404错误页面
* 统计所有500错误的页面
* 统计访问最频繁页面
* 统计访问处理时间最久页面
* 统计并发访问频率最高的页面


分析工具包括两大部分,一个是后台解释程序,每天执行一次对后台日志数据进行解析后保存到数据库中。
第二个是显示程序,从数据库中查询数据并生成相应的图表信息。
posted on 2008-04-14 08:11
x.matthew 阅读(15947)
评论(80) 编辑 收藏 所属分类:
Application Server