2010年2月3日

c++ difference from java
1. take charge of object management , negotiate ownershiop ,use scoped_ptr,
   not to transfer other's ownership
2. use c++ template to express seperation corncern ,such as (static)polymorphy and policy
3. disable copy constructor and assign operator by yourself
4. polymorphy by pointer
5. 使用 template ,macro 取得类似动态语言的能力
6. 偏好无状态的 函数
posted @ 2010-02-03 11:43 西津渡 阅读(243) | 评论 (0)编辑 收藏

2010年1月15日

    只有注册用户登录后才能阅读该文。阅读全文
posted @ 2010-01-15 12:22 西津渡 阅读(97) | 评论 (0)编辑 收藏

2010年1月5日

Myisam is preferred without transaction and little update(delete)

Big than 4G datafile can user Myisam merge table.

InnoDB with auto_increment primary key is preferred.

Few storage process

Guess: 20m records max per table , 500G data max per tablespace , 256 tables per database (may problem)

Use prepared statement and  batch

Optimize Your Queries For the Query Cache

// query cache does NOT work
$r = mysql_query("SELECT username FROM user WHERE signup_date >= CURDATE()");
 
// query cache works!
$today = date("Y-m-d");
$r = mysql_query("SELECT username FROM user WHERE signup_date >= '$today'");

EXPLAIN Your SELECT Queries

LIMIT 1 When Getting a Unique Row

Index and Use Same Column Types for Joins

Do Not ORDER BY RAND()

Avoid SELECT *

t is a good habit to always specify which columns you need when you are doing your SELECT’s.

Use ENUM over VARCHAR

Use NOT NULL If You Can

Store IP Addresses as UNSIGNED INT (?)

Fixed-length (Static) Tables are Faster

Vertical Partitioning

Vertical Partitioning is the act of splitting your table structure in a vertical manner for optimization reasons.

Example 1: You might have a users table that contains home addresses, that do not get read often. You can choose to split your table and store the address info on a separate table. This way your main users table will shrink in size. As you know, smaller tables perform faster.

Example 2: You have a “last_login” field in your table. It updates every time a user logs in to the website. But every update on a table causes the query cache for that table to be flushed. You can put that field into another table to keep updates to your users table to a minimum.

But you also need to make sure you don’t constantly need to join these 2 tables after the partitioning or you might actually suffer performance decline.

Split the Big DELETE or INSERT Queries

If you have some kind of maintenance script that needs to delete large numbers of rows, just use the LIMIT clause to do it in smaller batches to avoid this congestion.

Smaller Columns Are Faster

Use an Object Relational Mapper

f you do not need the time component, use DATE instead of DATETIME.

Consider horizontally spitting many-columned tables if they contain a lot of NULLs or rarely used columns.

Be an SQL programmer who thinks in sets, not procedural programming paradigms

InnoDB can’t optimize SELECT COUNT(*) queries. Use counter tables! That’s how to scale InnoDB.

Prefer MM with hive

refer :

http://blog.tuvinh.com/top-20-mysql-best-practices/

posted @ 2010-01-05 13:38 西津渡 阅读(378) | 评论 (0)编辑 收藏

2010年1月4日

    只有注册用户登录后才能阅读该文。阅读全文
posted @ 2010-01-04 15:11 西津渡 阅读(74) | 评论 (0)编辑 收藏

2009年12月30日


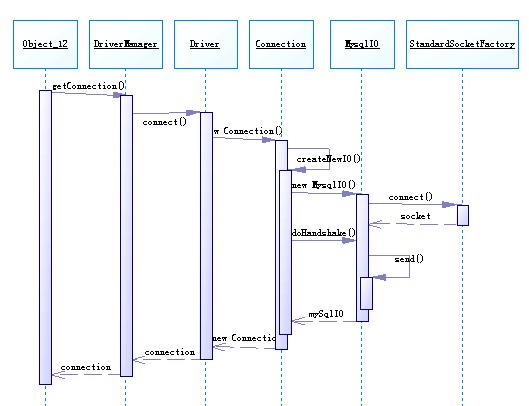
从时序图中可以看到,createNewIO()就是新建了一个com.mysql.jdbc.MysqlIO,利用 com.mysql.jdbc.StandardSocketFactory来创建一个socket。然后就由这个mySqlIO来与MySql服务器进行握手(doHandshake()),这个doHandshake主要用来初始化与Mysql server的连接,负责登陆服务器和处理连接错误。在其中会分析所连接的mysql server的版本,根据不同的版本以及是否使用SSL加密数据都有不同的处理方式,并把要传输给数据库server的数据都放在一个叫做packet的 buffer中,调用send()方法往outputStream中写入要发送的数据。


useServerPreparedStmts置为true的话,mysql驱动可以通过PreparedStatement的子类ServerPreparedStatement来实现真正的PreparedStatement的功能


第一位表示数据包的开始位置,就是数据存放的起始位置,一般都设置为0,就是从第一个位置开始。第二和第三个字节标识了这个数据包的大小,注意的是,这个大小是出去标识的4个字节的大小,对于非最后一个数据包来说,这个大小都是一样的,就是splitSize,也就是maxThreeBytes,它的值是 255 * 255 * 255。
最后一个字节中存放的就是数据包的编号了,从0开始递增。
在标识位设置完毕之后,就可以把255 * 255 * 255大小的数据从我们准备好的待发送数据包中copy出来了,注意,前4位已经是标识位了,所以应该从第五个位置开始copy数据

 # packetToSend = compressPacket(headerPacket, HEADER_LENGTH,    
#                 splitSize, HEADER_LENGTH); 

LoadBalancingConnectionProxy
package java.lang.reflect 。 proxy .


http://developer.51cto.com/art/200907/137823.htm

http://dev.mysql.com/doc/refman/5.1/en/connector-j-reference-implementation-notes.html

PreparedStatements are implemented by the driver, as MySQL does not have a prepared statement feature. Because of this, the driver does not implement getParameterMetaData() or getMetaData() as it would require the driver to have a complete SQL parser in the client.

Starting with version 3.1.0 MySQL Connector/J, server-side prepared statements and binary-encoded result sets are used when the server supports them.


但这是不是说PreparedStatement没用呢?不是的,PreparedStatement有其他的好处:
1.代码的可读性和可维护性
2.最重要的一点是极大地提高了安全性,可以防止SQL注入

然后我又看了一些网上其他人的经验,基本和我的判断一致,有两点要特别提请大家注意:

1.并不是说PreparedStatement在所有的DB上都不会提高效率,PreparedStatement需要服务器端的支持,比如在 Oracle上就会有显著效果。上面说的测试都是在MySQL上测试的,我找到了一个MySQL架构师的帖子,比较明确地说明了MySQL不支持 PreparedStatement。

2.即便PreparedStatement不能提高性能,在少数使用时甚至会降低效率,但仍然应该使用PreparedStatement!因为其他好 处实在是太大了!当然,当SQL查询比较复杂时,可能PreparedStatement好处会更大,只是我没有测试,不敢肯定。

3.既然PreparedStatement不能提高效率,那PreparedStatement Pool也就没有必要了。但可以看到每次新建Connection的开销实在很大,因此Connection Pool绝对必要。


posted @ 2009-12-30 12:41 西津渡 阅读(370) | 评论 (0)编辑 收藏

2009年12月14日

download ,annatation and tools 两个项目。
添加相关的 jar.

<taskdef name="hibernatetool" classname="org.hibernate.tool.ant.HibernateToolTask" classpathref="master.classpath" />

<target name="create_table">

<hibernatetool destdir="${script.dir}">
    <annotationconfiguration configurationfile="src/hibernate.cfg.xml" />
    <hbm2ddl export="false" create="true" delimiter=";" format="true" outputfilename="create-tables.sql" />
</hibernatetool>

</target>

<!DOCTYPE hibernate-configuration PUBLIC
    "-//Hibernate/Hibernate Configuration DTD 3.0//EN"
    "http://hibernate.sourceforge.net/hibernate-configuration-3.0.dtd">

<hibernate-configuration>
    <session-factory name="logi">
        <property name="show_sql">true</property>
        <mapping class="com.tt.logi.target.Target"/>
   
    </session-factory>
</hibernate-configuration>

import java.io.Serializable;

import javax.persistence.Basic;
import javax.persistence.Entity;
import javax.persistence.Id;

@Entity
public class Target implements Serializable{
   
    private Long id;
    private String name;
    @Id
    public Long getId() {
        return id;
    }
    public void setId(Long id) {
        this.id = id;
    }
    @Basic
    public String getName() {
        return name;
    }
    public void setName(String name) {
        this.name = name;
    }


posted @ 2009-12-14 19:04 西津渡 阅读(90) | 评论 (0)编辑 收藏
 
wget ftp://ftp.jaist.ac.jp/pub/mysql/Downloads/MySQL-5.1/mysql-5.1.41.tar.gz
tar -xzf


./configure --prefix=/usr/local/mysql51m --without-debug  --enable-local-infile --enable-assembler --enable-thread-safe-client --with-plugins=all

make
su -
make install


groupadd mysql
useradd -g mysql mysql


bin/mysql_install_db --user=mysql  --datadir=/var/lib/mysql51m/data

chown -R mysql /var/lib/mysql51m/
chgrp -R mysql /var/lib/mysql51m/


cp share/mysql/my-innodb-heavy-4G.cnf my.cnf
vi my.cnf

datadir = /var/lib/mysql51m/data

.bin/mysqld_safe --defaults-file=/usr/local/mysql51m/my.cnf &

bin/mysql  --defaults-file=my.cnf -uroot

./mysqladmin -u root password ‘humber’
grant all on *.* to root@% identified by 'humber'

default-character-set=utf8
init_connect='SET NAMES utf8'
default-storage-engine = INNODB

posted @ 2009-12-14 14:44 西津渡 阅读(103) | 评论 (0)编辑 收藏

2009年12月7日

jmap -heap 16761
jstat -gcutil 16761
jmap -finalizerinfo 16761
jmap -histo 16761
jstack -l 16761
jinfo 16761

Examine the fatal error log file. Default file name is hs_err_pidpid.log in the working-directory.

-XX:+HeapDumpOnOutOfMemoryError
java -agentlib:hprof=heap=dump,format=b application
$ jmap -dump:format=b,file=snapshot.jmap process-pid

1、在jvm启动时加上:-agentlib:hprof=heap=sites,file=heap.txt  ,然后执行一段时间后执行 kill -3 <pid>,就可以获取jvm的内存镜像。类似的通过-agentlib:hprof=cpu=samples,file=cpu.txt查 看cpu的状况。

http://java.sun.com/javase/6/webnotes/trouble/other/matrix6-Unix.html


Quick Troubleshooting Tips on Solaris OS and Linux for Java SE 6

This "Quick Start Guide" gives you some quick tips for troubleshooting. The subsections list some typical functions that can help you in troubleshooting, including one or more ways to get the information or perform the action.

These tips are organized as follows:

Hung, Deadlocked, or Looping Process
Post-mortem Diagnostics, Memory Leaks
Monitoring
Actions on a Remote Debug Server
Other Functions

Hung, Deadlocked, or Looping Process

  • Print thread stack for all Java threads:
    • Control-"
    • kill -QUIT pid
    • jstack pid (or jstack -F pid if jstack pid does not respond)
  • Detect deadlocks:
    • Request deadlock detection: JConsole tool, Threads tab
    • Print information on deadlocked threads: Control-"
    • Print list of concurrent locks owned by each thread: -XX:+PrintConcurrentLocks set, then Control-"
    • Print lock information for a process: jstack -l pid
  • Get a heap histogram for a process:
    • Start Java process with -XX:+PrintClassHistogram, then Control-"
    • jmap -histo pid (with -F option if pid does not respond)
  • Dump Java heap for a process in binary format to file:
    • jmap -dump:format=b,file=filename pid (with -F option if pid does not respond)
  • Print shared object mappings for a process:
    • jmap pid
  • Print heap summary for a process:
    • Control-"
    • jmap -heap pid
  • Print finalization information for a process:
    • jmap -finalizerinfo pid
  • Attach the command-line debugger to a process:
    • jdb -connect sun.jvm.hotspot.jdi.SAPIDAttachingConnector:pid=pid

Post-mortem Diagnostics, Memory Leaks

  • Examine the fatal error log file. Default file name is hs_err_pidpid.log in the working-directory.
  • Create a heap dump:
    • Start the application with HPROF enabled: java -agentlib:hprof=file=file,format=b application; then Control-"
    • Start the application with HPROF enabled: java -agentlib:hprof=heap=dump application
    • JConsole tool, MBeans tab
    • Start VM with -XX:+HeapDumpOnOutOfMemoryError; if OutOfMemoryError is thrown, VM generates a heap dump.
  • Browse Java heap dump:
    • jhat heap-dump-file
  • Dump Java heap from core file in binary format to a file:
    • jmap -dump:format=b,file=filename corefile
  • Get a heap histogram for a process:
    • Start Java process with -XX:+PrintClassHistogram, then Control-"
    • jmap -histo pid (with -F option if pid does not respond)
  • Get a heap histogram from a core file:
    • jmap -histo corefile
  • Print shared object mappings from a core file:
    • jmap corefile
  • Print heap summary from a core file:
    • jmap -heap corefile
  • Print finalization information from a core file:
    • jmap -finalizerinfo corefile
  • Print Java configuration information from a core file:
    • jinfo corefile
  • Print thread trace from a core file:
    • jstack corefile
  • Print lock information from a core file:
    • jstack -l corefile
  • Attach the command-line debugger to a core file on the same machine:
    • jdb -connect sun.jvm.hotspot.jdi.SACoreAttachingConnector:javaExecutable=path,core=corefile
  • Attach the command-line debugger to a core file on a different machine:
    • On the machine with the core file: jsadebugd path corefile
      and on the machine with the debugger: jdb -connect sun.jvm.hotspot.jdi.SADebugServerAttachingConnector:debugServerName=machine
  • libumem can be used to debug memory leaks.

Monitoring

Note: The vmID argument for the jstat command is the virtual machine identifier. See the jstat man page for a detailed explanation.

  • Print statistics on the class loader:
    • jstat -class vmID
  • Print statistics on the compiler:
    • Compiler behavior: jstat -compiler vmID
    • Compilation method statistics: jstat -printcompilation vmID
  • Print statistics on garbage collection:
    • Summary of statistics: jstat -gcutil vmID
    • Summary of statistics, with causes: jstat -gccause vmID
    • Behavior of the gc heap: jstat -gc vmID
    • Capacities of all the generations: jstat -gccapacity vmID
    • Behavior of the new generation: jstat -gcnew vmID
    • Capacity of the new generation: jstat -gcnewcapacity vmID
    • Behavior of the old and permanent generations: jstat -gcold vmID
    • Capacity of the old generation: jstat -gcoldcapacity vmID
    • Capacity of the permanent generation: jstat -gcpermcapacity vmID
  • Monitor objects awaiting finalization:
    • JConsole tool, VM Summary tab
    • jmap -finalizerinfo pid
    • getObjectPendingFinalizationCount method in java.lang.management.MemoryMXBean class
  • Monitor memory:
    • Heap allocation profiles via HPROF: java -agentlib:hprof=heap=sites
    • JConsole tool, Memory tab
    • Control-" prints generation information.
  • Monitor CPU usage:
    • By thread stack: java -agentlib:hprof=cpu=samples application
    • By method: java -agentlib:hprof=cpu=times application
    • JConsole tool, Overview and VM Summary tabs
  • Monitor thread activity:
    • JConsole tool, Threads tab
  • Monitor class activity:
    • JConsole tool, Classes tab

Actions on a Remote Debug Server

First, attach the debug daemon jsadebugd, then execute the command:

  • Dump Java heap in binary format to a file: jmap -dump:format=b,file=filename hostID
  • Print shared object mappings: jmap hostID
  • Print heap summary : jmap -heap hostID
  • Print finalization information : jmap -finalizerinfo hostID
  • Print lock information : jstack -l hostID
  • Print thread trace : jstack hostID
  • Print Java configuration information: jinfo hostID

Other Functions

  • Interface with the instrumented Java virtual machines:
    • Monitor for the creation and termination of instrumented VMs: jstatd daemon
    • List the instrumented VMs: jps
    • Provide interface between remote monitoring tools and local VMs: jstatd daemon
    • Request garbage collection: JConsole tool, Memory tab
  • Print Java configuration information from a running process:
    • jinfo pid
  • Dynamically set, unset, or change the value of certain Java VM flags for a process:
    • jinfo -flag flag
  • Print command-line flags passed to the VM:
    • jinfo -flags
  • Print Java system properties:
    • jinfo -sysprops
  • Pass a Java VM flag to the virtual machine:
    • jconsole -Jflag ...
    • jhat -Jflag ...
    • jmap -Jflag ...
  • Print statistics of permanent generation of Java heap, by class loader:
    • jmap -permstat
  • Report on monitor contention.
    • java -agentlib:hprof=monitor=y application
  • Evaluate or execute a script in interactive or batch mode:
    • jrunscript
  • Interface dynamically with an MBean, via JConsole tool, MBean tab:
    • Show tree structure.
    • Set an attribute value.
    • Invoke an operation.
    • Subscribe to notification.
  • Run interactive command-line debugger:
    • Launch a new VM for the class: jdb class
    • Attach debugger to a running VM: jdb -attach address
    http://www.blogjava.net/justinchen/archive/2009/01/08/248738.html
posted @ 2009-12-07 14:16 西津渡 阅读(414) | 评论 (0)编辑 收藏
 
netstat -n | awk '/^tcp/ {++state[$NF]} END {for(key in state) print key,""t",state[key]}'

posted @ 2009-12-07 13:42 西津渡| 编辑 收藏

2009年10月29日

set nocompatible
set autoindent
set smartindent
set ignorecase
syntax enable
set wrap
set showmatch
set foldmarker={{{,}}}
set tabstop=4
set shiftwidth=4
set ruler
set expandtab
set backspace=eol,start,indent
set whichwrap+=<,>,h,l
set nobackup
setlocal noswapfile
set bufhidden=hide
syntax on
set tags=./tags,~/apsara/tags
set path+=/usr/include/c++/**,~/apsara/include/**
filetype plugin on
filetype indent on
autocmd filetype java,c,cpp setlocal textwidth=100
set pastetoggle=<F7>

nmap <F2>  :set nonumber!<CR>
nmap <F8>  :TlistToggle<CR>
imap <F11> <C-x><C-p>
map <F12>  :!ctags -R --c++-kinds=+p --fields=+iaS --exclude=build --extra=+q .<CR>
map <F6> :w<CR>
imap <F6> <ESC>:w<CR>a
map <F3> /<C-R><C-W><CR>

有 c support 支持,很棒。

posted @ 2009-10-29 11:42 西津渡 阅读(223) | 评论 (0)编辑 收藏
仅列出标题  下一页