Database performance is the critical component of a web application. Recently, we spend lots of time to monitor and analyze SQL server performance based on SQL profiling log. However, SQL
profiling log is row-based result set and is difficult to do trouble
shooting directly. This message is trying to introduce some very good SQL monitoring and profiling tools to get much better SQL profiling result.
Another Chinese Article on this topic
There
is a very good article about this topic. However, it is Chinese
version.
“http://www.ibm.com/developerworks/cn/java/j-lo-p6spy/index.html#resources”.
Background
So, we are going to introduce three tools: P6Spy, IronTrackSQL and SQL Profiler (NOT SQL Server Profiler). Using these tools are very easy to log all SQL statements and show the detailed statistics results.
P6Spy
is an open source framework for applications that intercept and
optionally modify database statements. The P6Spy distribution includes
the following modules:
- P6Log. P6Log intercepts and logs the database statements of any application that uses JDBC. P6Spy is designed to be installed in minutes and requires no code changes.
- P6Outage.
P6Outage detects long-running statements that may be indicative of a
database outage proble and will log any statement that surpasses the
configurable time boundary during its execution.
The deployment is very easy
- Copy p6spy.jar to CLASSPATH. if web application, copy it to YourWebApp/WEB-INF/lib/
- Copy spy.properties to CLASSPATH. if web application, copy it to YourWebApp/WEB-INF/classess/. NOTE: it is not lib.
- Find
your database connection setting, for example, Database resource
setting within context.xml, and use “com.p6spy.engine.spy.P6SpyDriver”
to replace the original driver class
- Update the property “realdriver” as your real database driver as following:
realdriver=net.sourceforge.jtds.jdbc.Driver
- Run you application, and you find “spy.log” in your bin folder. And this log file path can be updated in spy.properties
The Log Format
current time|execution time|category|statement SQL String|effective SQL string
1237024804522|93|5|statement|SELECT vp.purchaseID, vp.externalVendorID,
vp.uniqueID, vp.purchaseWord, vp.purchaseValue, vp.purchaseType,
vs.chains AS brands, vs.starRating, vs.amenities, vs.types,
vsd.communityRatingTotal, vsd.communityRatingCount FROM
VS_VendorPurchase AS vp LEFT JOIN VS_VendorSearch AS vs ON
vp.externalVendorID = vs.externalVendorID LEFT JOIN VS_VendorSearchData
AS vsd ON vp.externalVendorID = vsd.externalVendorID |SELECT
vp.purchaseID, vp.externalVendorID, vp.uniqueID, vp.purchaseWord,
vp.purchaseValue, vp.purchaseType, vs.chains AS brands, vs.starRating,
vs.amenities, vs.types, vsd.communityRatingTotal,
vsd.communityRatingCount FROM VS_VendorPurchase AS vp LEFT JOIN
VS_VendorSearch AS vs ON vp.externalVendorID = vs.externalVendorID LEFT
JOIN VS_VendorSearchData AS vsd ON vp.externalVendorID =
vsd.externalVendorID
Other Setting:
P6Spy have lot of customized setting, such as time format, included
table names or excluded table names, the interval values used to
identify the long-running SQL, etc. Please see http://www.p6spy.com/documentation/other.htm.
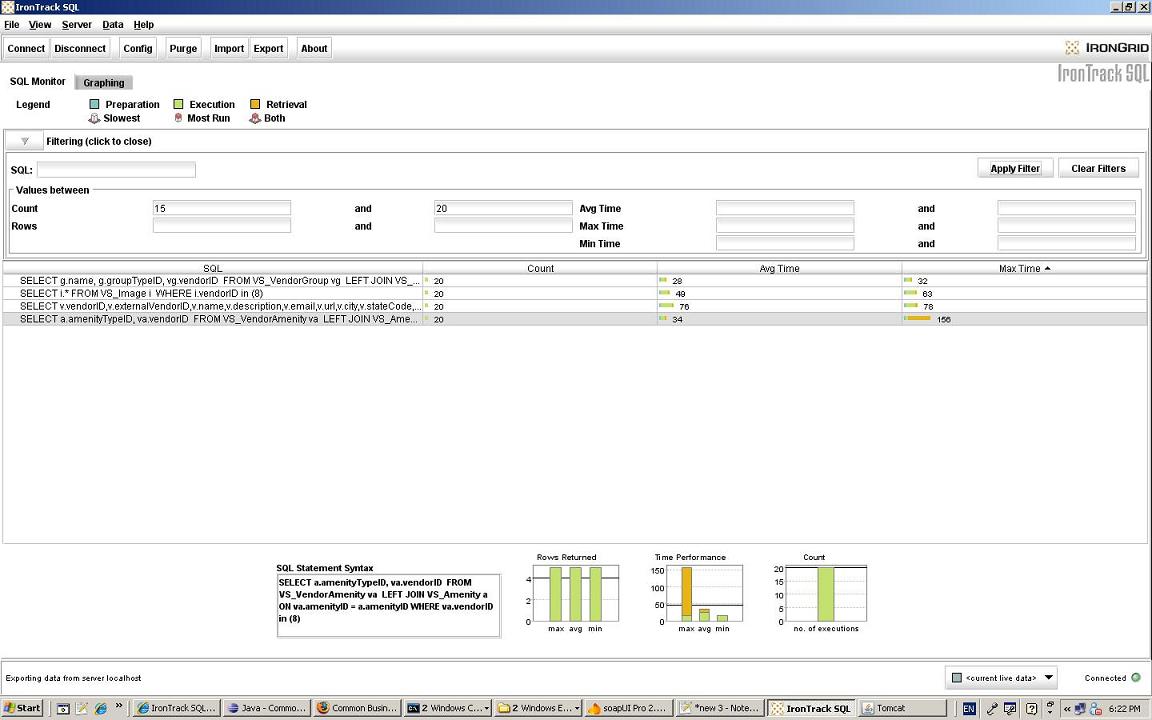
IronTrack SQL provides a GUI interface with reports and graphs and a detailed analysis of any SQL statement, comparing it with the system average.
The deployment is also very easy
- First of all, all jar files and property file need be copied from IronTrackSQL.zip
- Copy irontracksql.jar, p6spy.jar and log4j-1.2.8.jar to CLASSPATH. if web application, copy it to YourWebApp/WEB-INF/lib/.
- Copy spy.properties to CLASSPATH. if web application, copy it to YourWebApp/WEB-INF/classess/. NOTE: it is not lib.
- Find
your database connection setting, for example, Database resource
setting within context.xml, and use “com.p6spy.engine.spy.P6SpyDriver”
to replace the original driver class
- Update the property “realdriver” as your real database driver as following:
realdriver=net.sourceforge.jtds.jdbc.Driver
- Run you application, and you find “spy.log” in your bin folder. And this log file path can be updated in spy.properties
- Double click irontracksql.jar to start GUI,
and click “File=>Connect” to connect to your application (or web
server). From the status bar, you will see the connection information
if successfully connecting to application
GUI example
- please see attached file
- You can see count, average time and max time for each SQL statement
- And you can filter logs based on some filter conditions, such as avg time from 10ms to 15ms
Analyzing SQL Statement Performance with the SQL Monitor Section
- High preparation time
Queries that require high preparation time may perform unnecessary
activities in the time between when a statement is initialized and when
it is executed. Consider moving any code related to building the SQL query before creating the Statement object.
- Frequent queries
- Consider queries that are called frequently as candidates for data caching.
- The
Java PreparedStatement object gives the database an opportunity to
pre-parse the query, which can save time when a query is called
repeatedly.
- Consider consolidating multiple queries of the same table into a single statement.
- High
execution time — Time spent in the executeQuery() or executeUpdate()
methods is time that the database is spending to process and execute
the query.
- High retrieval time — Retrieval time includes
all of the time spent returning records from the database to the
application. The primary drivers of this time are the number of rows
returned, and the amount of data in each row. Examine queries for
opportunities to limit the number of columns, rows, or both returned.
SQL Profiler – Not SQL Server Profiling
This Swing-based SQL profiler tries to offer a tool to monitor which tables and columns are accessed the most in SQL queries to recommend index creation.
The
tool has the very similar capabilities of IronTrackSQL. However, i
think IronTrackSQL has a better user interface. I recommend you to use
IronTrackSQL.
However, this tool can generate recommended indexes based on the SQL log. This is a very interesting feature.
Overall
Overall, these 3 tools facilitate developers on SQL
statement logging and profiling without any code change, and is
independent to any web container and database management system.
Any issue, please let me know.
posted on 2009-03-14 21:06
Justin Chen 阅读(3628)
评论(0) 编辑 收藏 所属分类:
Tools