本Blog所有内容不得随意转载,版权属于作者所有。如需转载请与作者联系(
fastzch@163.com
)。
未经许可的转载,本人保留一切法律权益。
一直以来,发现有某些人完全不尊重我的劳动成果,随意转载,提醒一下那些人小心哪天惹上官司。
IBM Pattern Modeling and Analysis Tool for Java Garbage Collector(简称GA),大名鼎鼎的IBM用来分析JDK GC日志的工具,2008年8月23日,更新至2.6版,增加了对Java 6 GC日志的分析。
我想这也是为了配合Websphere Application Server 7.0的测试版发布,在我之前的一篇文章《
WebSphere Application Server 7.0 初体验》中曾经提到,GCViewer这个工具目前还无法查看其GC的日志,现在不用担心这个问题了,用GA2.6来看吧。
来看看官方的简介:
 What is Pattern Modeling and Analysis Tool for IBM Java Garbage Collector?

 Pattern Modeling and Analysis Tool for IBM® Java™ Garbage Collector (PMAT) parses verbose GC trace, analyzes Java heap usage, and recommends key configurations based on pattern modeling of Java heap usage.

 When the JVM (Java virtual machine) cannot allocate an object from the current heap because of lack of space, a memory allocation fault occurs, and the Garbage Collector is invoked. The first task of the Garbage Collector is to collect all the garbage that is in the heap. This process starts when any thread calls the Garbage Collector either indirectly as a result of allocation failure or directly by a specific call to System.gc(). The first step is to get all the locks needed by the garbage collection process. This step ensures that other threads are not suspended while they are holding critical locks. All other threads are then suspended. Garbage collection can then begin. It occurs in three phases: Mark, Sweep, and Compaction (optional).

 Verbose GC is a command-line option that one can supply to the JVM at start-up time. The format is: -verbose:gc or -verbosegc. This option switches on a substantial trace of every garbage collection cycle. The format for the generated information is not designed and therefore varies among various platforms and releases.

 This trace should allow one to see the gross heap usage in every garbage collection cycle. For example, one could monitor the output to see the changes in the free heap space and the total heap space. This information can be used to determine whether garbage collections are taking too long to run; whether too many garbage collections are occurring; and whether the JVM crashed during garbage collection.

更多讯息,可以参考其官方网站:
http://alphaworks.ibm.com/tech/pmatWAS的GC日志的获得方法,可以参见我的另一篇文章《
WebSphere Application Server 7.0 初体验》,当然也可以看WAS的文档或此软件的文档。
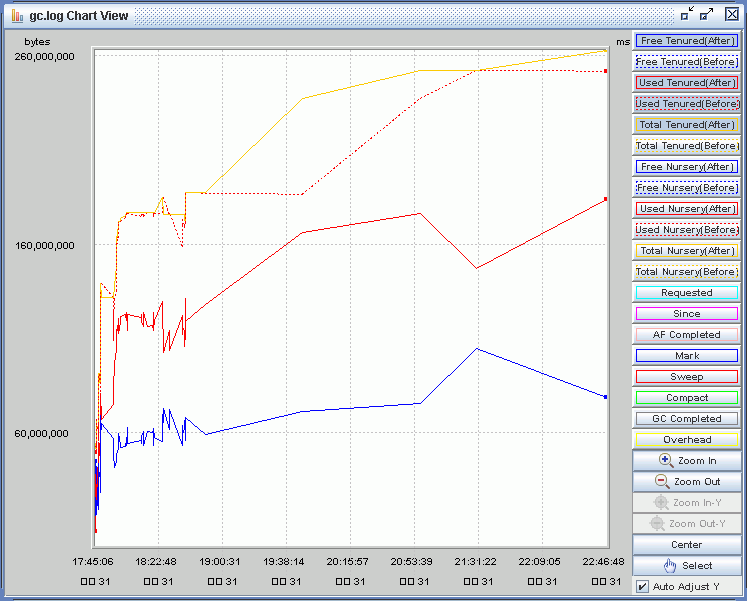
下图是我试用WAS7.0产生的GC Log的Chart View:

有兴趣的朋友们可以试试看。
posted on 2008-09-01 00:11
Robin's Programming World 阅读(3304)
评论(0) 编辑 收藏 所属分类:
Java 、
Webshere