问题:
画页面 或 报表 的 图象问题
解决:用 通过xml画图 画笔wz_jsgraphics.js
xml数据取得 prototype.js
画动作 Xmlgraphics.js (自己包装)
下载:
http://www.blogjava.net/Files/Good-Game/Mywz_jsgraphics.rar 请放在 服务器上(tomcat) 并改 testLine.html页面上的 load( ul ) =>>
ul ( xml 的取得地方 )
请注意 : IE 5 支持不好 请用 火狐 或 IE6
图片 :
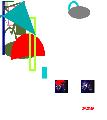
EG:
这展现了 画线 画图 到 画字的简单过程
<grabhics>
<line x1='0' y1='0' x2='40' y2='0' color='green' stroke='4' />
<line id='l1' x1='0' y1='0' x2='0' y2='200' color='darkblue' stroke='8' />
<rect x='20' y='20' w='40' h='70' color='hotpink' stroke='4' />
<rect id='r1' x='100' y='60' w='20' h='200' color='greenyellow' stroke='8' />
<fillRect x='50' y='60' w='40' h='70' color='darkolivegreen' stroke='2' />
<fillRect id='fr1' x='150' y='250' w='20' h='45' color='darkturquoise' stroke='1' />
<ellipse x='0' y='100' w='50' h='100' color='darkolivegreen' stroke='5' />
<ellipse id='e1' x='250' y='0' w='34' h='46' color='darkturquoise' stroke='7' />
<fillEllipse x='0' y='150' w='150' h='70' color='darkolivegreen' stroke='5' />
<fillEllipse id='fe1' x='250' y='20' w='84' h='48' color='gray' stroke='7' />
<fillArc x='32' y='124' w='130' h='170' start='0' end='190' color='red' />
<fillArc id='fa1' x='200' y='300' w='40' h='20' start='0' end='300' color='red' />
<polygon xs='32,80,23,7,64' ys='124,2,42,24,6' color='darkolivegreen' />
<polygon id='pp1' xs='32,4,2' ys='124,3,51' color='darkolivegreen' />
<fillPolygon xs='10,85,93,60' ys='50,10,105,87' color='00aaaa' />
<fillPolygon id='adfh' xs='80,126,-30,-60' ys='0,130,40,100' color='00aaaa' />
<image x='200' y='300' w='50' h='50' url='../image/test.bmp' />
<image id='ima' x='300' y='300' w='50' h='50' url='../image/test.bmp' />
<string font='arial' size='15' style='Font.ITALIC_BOLD' str='刘凯毅' x='300' y='400' color='red' />
<string id='strr' font='arial' size='20' style='Font.ITALIC_BOLD' str='万岁' x='310' y='420' />
</grabhics>
简单页面 : 给出 div 的 id (位置 和 xml 的出处 就可以了)load() 方法
<!DOCTYPE HTML PUBLIC "-//W3C//DTD HTML 4.01//ZH-CN" "http://www.w3.org/TR/html4/strict.dtd">
<html>
<head>
<meta http-equiv="Content-Type" content="text/html; charset=UTF-8" />
<script language="JavaScript" src='../lib/prototype/wz_jsgraphics.js' ></script>
<script language="JavaScript" src="../lib/prototype/prototype.js"></script>
<script language="JavaScript" src="../js/test.js" ></script>
<script language="JavaScript" src="../js/Xmlgraphics.js" ></script>
</head>
<body onload='load( "http://127.0.0.1:8000/Mywz_jsgraphics/xml/graphics.xml" )'>
<div id="myCanvas" style="position:relative;height:250px;width:100%;"> <input type='button' onclick='tt()' /> </div>
</body>
</html>
<script>
function tt(){
var uu = 'strr'
var g2 = getGdom(uu) ;
getValue(uu).clear();
}
</script>