在上一个示例
(spring struts ibatis)
的基础上引入
JFreeChart
组件。
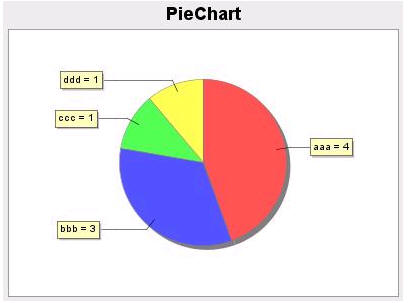
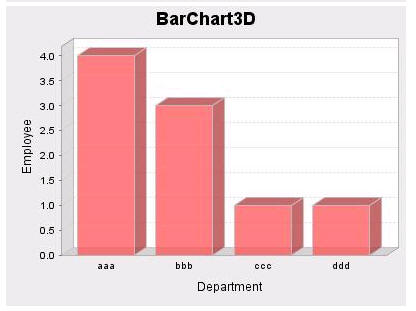
问题:统计各部门员工的人数,并用饼状或柱状图显示出来。
要把
JFreeChart
引入到工程中来,有以下
3
步:
1.
在
lib
中加入
jcommon-1.0.0.jar, jfreechart-1.0.0.jar
2.
写一个
servlet : ChartServlet.java
3.
在页面中调用这个
servlet
输出图形
.
首先以文本的方式
<
table
>
<
c:forEach
var
=
"countMap"
items
=
"
${employeeCounts}">
<
tr
>
<
td
>
<
c:out
value
=
"
${countMap.DEPT_NAME}"></c:out>
</
td
>
<
td
>
<
c:out
value
=
"
${countMap.EMP_COUNT}"></c:out>
</
td
>
</
tr
>
</
c:forEach
>
</
table
>
再以图形的方式
<
IMG
src
=
"
<
c:url
value
=
"/chart?type=pie"
/>
"
alt
=
"by Department"
>
<
IMG
src
=
"
<
c:url
value
=
"/chart?type=bar3d"
/>
"
alt
=
"by Department"
>
学习笔记:
1.
起初我尝试以
IoC
的方式将
Service
注入到
Servlet
中,不成功,后来查资料解决,
详见:
http://www.jactiongroup.net/spring/viewtopic.php?p=6443
2.
第一步是写
Servlet
1 public class ChartServlet extends HttpServlet {
2 private EmployeeService empService;
3
4 @Override
5 protected void doGet(HttpServletRequest request, HttpServletResponse response)
6 throws ServletException, IOException {
7 doPost(request, response);
8 }
9
10 @Override
11 protected void doPost(HttpServletRequest request,
12 HttpServletResponse response) throws ServletException, IOException {
13 WebApplicationContext wac = WebApplicationContextUtils
14
15 .getRequiredWebApplicationContext(getServletContext());
16 empService = (EmployeeService) wac.getBean("employeeService");
17 String chartType = request.getParameter("type").toUpperCase();
18 response.setContentType("image/jpeg");
19 JFreeChart chart = getChart(chartType);
20 ChartUtilities.writeChartAsJPEG(response.getOutputStream(), 100, chart,
21
22 400, 300, null);
23 }
24
25 public JFreeChart getChart(String type) {
26 List list = empService.getEmployeeCounts();
27 JFreeChart chart = null;
28 if (type.indexOf("PIE") == 0) {
29 DefaultPieDataset data = new DefaultPieDataset();
30 Iterator it = list.iterator();
31 while (it.hasNext()) {
32 Map m = (Map) it.next();
33 data.setValue((String) m.get("DEPT_NAME"), (Long) m
34
35 .get("EMP_COUNT"));
36
37 }
38 if ("PIE".equals(type)) {
39 chart = ChartFactory.createPieChart("PieChart", data, false,
40
41 false, false);
42 } else {
43 chart = ChartFactory.createPieChart3D("PieChart3D", data,
44
45 false, false, false);
46 }
47 } else {
48 DefaultCategoryDataset data = new DefaultCategoryDataset();
49 Iterator it = list.iterator();
50 while (it.hasNext()) {
51 Map m = (Map) it.next();
52 data.addValue((Long) m.get("EMP_COUNT"), "Department",
53
54 (String) m.get("DEPT_NAME"));
55 }
56
57 if ("BAR".equals(type)) {
58 chart = ChartFactory.createBarChart("BarChart", "Department", "Employee",
59
60 data, PlotOrientation.VERTICAL, false, false, false);
61 } else {
62 chart = ChartFactory.createBarChart3D("BarChart3D", "Department",
63
64 "Employee", data, PlotOrientation.VERTICAL, false, false,
65
66 false);
67 }
68 }
69 return chart;
70 }
71
72 }
73
74
其中会用到Service层中新增加的接口List list = empService.getEmployeeCounts();
提示这个方法不存在,利用
Eclipse
的
Ctrl+1
功能
,
逐层添加
service -> serviceimpl -> dao - > daoimpl,
即快速又不易出错。
值得注意的是:
第33行
,
这里要强制转换成
Long
型,因为
iBATIS
中
count( )
函数的返回值为
Long
类型
.
如果要在
Servlet
中使用
Spring
提供的
Bean
配置文件,需要用到
WebApplicationContextUtils
,不过先要在
web.xml
中添加一个
Listener
才可以使用。
<context-param>
<param-name>
contextConfigLocation
</param-name>
<param-value>
classpath:spring.xml
</param-value>
</context-param>
<listener>
<listener-class>
org.springframework.web.context.ContextLoaderListener
</listener-class>
</listener>
最后一步是在
iBATIS
的
Mapping
文件中加入
SQL
语句。。。。。。。
<select
id=
"getEmployeeCounts"
resultClass=
"java.util.HashMap"
cacheModel=
"employeesCache"
>
SELECT
d.name as DEPT_NAME,
count(e.id) as EMP_COUNT
FROM employee e, department d
WHERE e.dept_id = d.id
GROUP BY d.name
</select>
通过两次
DEMO
,发现
iBATIS
算是不错的东东,
配置比
Hibernate
简单,使用上又比
JDBC
简单。