本文是:
ExtJS 入门学习之 MessageBox篇
之姐妹篇。本期主要是总结extjs中grid的使用。首先建立HTML如下:
<!
DOCTYPE HTML PUBLIC "-//W3C//DTD HTML 4.01//EN" "http://www.w3.org/TR/html4/strict.dtd"
>
<
html
>
<
head
>
<
meta
http-equiv
="Content-Type"
content
="text/html; charset=UTF-8"
/>
<
link
rel
="stylesheet"
type
="text/css"
href
="ext/resources/css/ext-all.css"
>
<
script
type
="text/javascript"
src
="ext/ext-base.js"
></
script
>
<
script
type
="text/javascript"
src
="ext/ext-all.js"
></
script
>
<
title
>
学习ExtJS之Panel
</
title
>
<
script
type
="text/javascript"
>
Ext.onReady(
function
()
{
//
构造表格的数据
var
data
=
[
[
1
,'a0','a1','a2'],
[
2
,'b0','b1','b2'],
[
3
,'c0','c1','c2'],
[
4
,'d0','d1','d2']];
//
数据字段指定
var
store
=
new
Ext.data.SimpleStore({data:data,fields:[
"
id
"
,
"
X0
"
,
"
X1
"
,
"
X2
"
]});
//
建立表格对象
var
grid
=
new
Ext.grid.GridPanel(
{
renderTo:
"
hello
"
,
//
绑定的DIV ID
title:
"
标题
"
,
height:
150
,
width:
600
,
//
表格头
columns:[
{header:
"
第一列名称
"
,dataIndex:
"
X0
"
},
{header:
"
第二列名称
"
,dataIndex:
"
X1
"
},
{header:
"
第三列名称
"
,dataIndex:
"
X2
"
}],
store:store,
autoExpandColumn:
2
}); });
</
script
>
</
head
>
<
body
>
<
div
id
="hello"
>
</
div
>
</
body
>
</
html
>
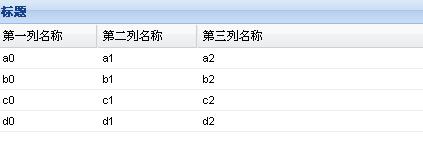
这里创建了最简单的表格。其中大致可以看到结构是数据对象(二维数组),然后是一个配置对象,最后便是创建实体对象。
我们稍微在创建对象的时候改变属性。
var
grid
=
new
Ext.grid.GridPanel(
{
renderTo:
"
hello
"
,
//
绑定的DIV ID
title:
"
标题
"
,
height:
150
,
width:
600
,
//
表格头
cm:
new
Ext.grid.ColumnModel([
{header:
"
第一列名称
"
,dataIndex:
"
X0
"
,sortable:
true
},
{header:
"
第二列名称
"
,dataIndex:
"
X1
"
,sortable:
true
},
{header:
"
第三列名称
"
,dataIndex:
"
X2
"
}]),
store:store,
autoExpandColumn:
2
});
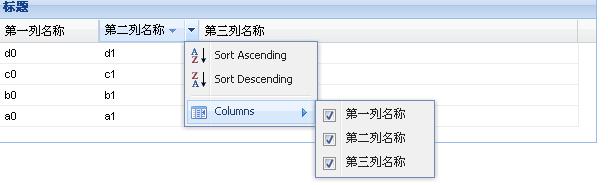
可见就是其中 columns 改成了 cm 而属性值是构造了ColumnModel。
而加入了sorttable属性,就可以排序了。
效果图如下:
你如果觉得正序是中文就更好了。不急,extjs为我们想到了,只需要引入一个资源脚本文件:
<script type ="text/javascript" src="ext/ext-lang-zh_CN.js" ></script>
看看效果呢:
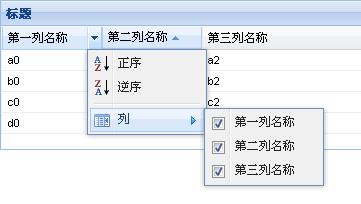
怎么样是不是感觉很周到呢?
显示渲染效果。加入我们要将第三列加上链接,添加一个属性renderer:show :
{header:"第三列名称",dataIndex:"X2",renderer:show}]),
function show(value)
{
return "
<
a
href
="+value+"
>
"+value+"
</
a
>
";
}
加一个函数显示函数就OK了。
extjs 还有一个比较强大的,直接用json作为其数据对象,那样我们就不必构造2维数组。
不过用Ext.data.JsonStore替代Ext.data.SimpleStore。 如下面代码所示:
<!
DOCTYPE HTML PUBLIC "-//W3C//DTD HTML 4.01//EN" "http://www.w3.org/TR/html4/strict.dtd"
>
<
html
>
<
head
>
<
meta
http-equiv
="Content-Type"
content
="text/html; charset=UTF-8"
/>
<
link
rel
="stylesheet"
type
="text/css"
href
="ext/resources/css/ext-all.css"
>
<
script
type
="text/javascript"
src
="ext/ext-base.js"
></
script
>
<
script
type
="text/javascript"
src
="ext/ext-all.js"
></
script
>
<
script
type
="text/javascript"
src
="ext/ext-lang-zh_CN.js"
></
script
>
<
title
>
学习ExtJS之Panel
</
title
>
<
script
type
="text/javascript"
>
function
show(value)
{
return
"
<a href=
"
+
value
+
"
>
"
+
value
+
"
</a>
"
;
}
Ext.onReady(
function
()
{
//
构造表格的数据
var
data
=
[
{id:
1
,X0:'a0',X1:'a1',X2:'a2'},
{id:
2
,X0:'b0',X1:'b1',X2:'b2'},
{id:
3
,X0:'c0',X1:'c1',X2:'c2'},
{id:
4
,X0:'d0',X1:'d1',X2:'d2'}];
//
数据字段指定
var
store
=
new
Ext.data.JsonStore({data:data,fields:[
"
id
"
,
"
X0
"
,
"
X1
"
,
"
X2
"
]});
//
建立表格对象
var
grid
=
new
Ext.grid.GridPanel(
{
renderTo:
"
hello
"
,
//
绑定的DIV ID
title:
"
标题
"
,
height:
150
,
width:
600
,
//
表格头
cm:
new
Ext.grid.ColumnModel([
{header:
"
第一列名称
"
,dataIndex:
"
X0
"
,sortable:
true
},
{header:
"
第二列名称
"
,dataIndex:
"
X1
"
,sortable:
true
},
{header:
"
第三列名称
"
,dataIndex:
"
X2
"
,renderer:show}]),
store:store,
autoExpandColumn:
2
});
});
</
script
>
</
head
>
<
body
>
<
div
id
="hello"
>
</
div
>
</
body
>
</
html
>
当然extjs是不会忽视xml作为数据对象的。不过我一直觉得在js中用json必用xml更加爽,所以这部分就不总结了。有兴趣的朋友可以自行研究了。还有可编辑表格,还有他的日历控件,都只有下次再补充学习了。这次代码是在记事本里随便写的,所以比较凌乱。如果对你阅读造成不良影响,万分抱歉。下次一定搞整齐点。
下面附带一个其自带的范例:
<
html
>
<
head
>
<
meta
http-equiv
="Content-Type"
content
="text/html; charset=iso-8859-1"
>
<
title
>
Array Grid Example
</
title
>
<
link
rel
="stylesheet"
type
="text/css"
href
="ext/resources/css/ext-all.css"
/>
<
script
type
="text/javascript"
src
="ext/ext-base.js"
></
script
>
<
script
type
="text/javascript"
src
="ext/ext-all.js"
></
script
>
<
script
type
="text/javascript"
src
="array-grid.js"
></
script
>
</
head
>
<
body
>
<
div
id
="grid-example"
></
div
>
</
body
>
</
html
>
实现主要放在:array-grid.js中:
Ext.onReady(
function
(){
Ext.state.Manager.setProvider(
new
Ext.state.CookieProvider());
var
myData
=
[
['3m Co',
71.72
,
0.02
,
0.03
,'
9
/
1
12
:00am'],
['Alcoa Inc',
29.01
,
0.42
,
1.47
,'
9
/
1
12
:00am'],
['Altria Group Inc',
83.81
,
0.28
,
0.34
,'
9
/
1
12
:00am'],
['American Express Company',
52.55
,
0.01
,
0.02
,'
9
/
1
12
:00am'],
['American International Group, Inc.',
64.13
,
0.31
,
0.49
,'
9
/
1
12
:00am'],
['AT
&
T Inc.',
31.61
,
-
0.48
,
-
1.54
,'
9
/
1
12
:00am'],
['Boeing Co.',
75.43
,
0.53
,
0.71
,'
9
/
1
12
:00am'],
['Caterpillar Inc.',
67.27
,
0.92
,
1.39
,'
9
/
1
12
:00am'],
['Citigroup, Inc.',
49.37
,
0.02
,
0.04
,'
9
/
1
12
:00am'],
['E.I. du Pont de Nemours and Company',
40.48
,
0.51
,
1.28
,'
9
/
1
12
:00am'],
['Exxon Mobil Corp',
68.1
,
-
0.43
,
-
0.64
,'
9
/
1
12
:00am'],
['General Electric Company',
34.14
,
-
0.08
,
-
0.23
,'
9
/
1
12
:00am'],
['General Motors Corporation',
30.27
,
1.09
,
3.74
,'
9
/
1
12
:00am'],
['Hewlett
-
Packard Co.',
36.53
,
-
0.03
,
-
0.08
,'
9
/
1
12
:00am'],
['Honeywell Intl Inc',
38.77
,
0.05
,
0.13
,'
9
/
1
12
:00am'],
['Intel Corporation',
19.88
,
0.31
,
1.58
,'
9
/
1
12
:00am'],
['International Business Machines',
81.41
,
0.44
,
0.54
,'
9
/
1
12
:00am'],
['Johnson
&
Johnson',
64.72
,
0.06
,
0.09
,'
9
/
1
12
:00am'],
['JP Morgan
&
Chase
&
Co',
45.73
,
0.07
,
0.15
,'
9
/
1
12
:00am'],
['McDonald\'s Corporation',
36.76
,
0.86
,
2.40
,'
9
/
1
12
:00am'],
['Merck
&
Co., Inc.',
40.96
,
0.41
,
1.01
,'
9
/
1
12
:00am'],
['Microsoft Corporation',
25.84
,
0.14
,
0.54
,'
9
/
1
12
:00am'],
['Pfizer Inc',
27.96
,
0.4
,
1.45
,'
9
/
1
12
:00am'],
['The Coca
-
Cola Company',
45.07
,
0.26
,
0.58
,'
9
/
1
12
:00am'],
['The Home Depot, Inc.',
34.64
,
0.35
,
1.02
,'
9
/
1
12
:00am'],
['The Procter
&
Gamble Company',
61.91
,
0.01
,
0.02
,'
9
/
1
12
:00am'],
['United Technologies Corporation',
63.26
,
0.55
,
0.88
,'
9
/
1
12
:00am'],
['Verizon Communications',
35.57
,
0.39
,
1.11
,'
9
/
1
12
:00am'],
['Wal
-
Mart Stores, Inc.',
45.45
,
0.73
,
1.63
,'
9
/
1
12
:00am']
];
//
example of custom renderer function
function
change(val){
if
(val
>
0
){
return
'
<
span style
=
"
color:green;
"
>
'
+
val
+
'
</
span
>
';
}
else
if
(val
<
0
){
return
'
<
span style
=
"
color:red;
"
>
'
+
val
+
'
</
span
>
';
}
return
val;
}
//
example of custom renderer function
function
pctChange(val){
if
(val
>
0
){
return
'
<
span style
=
"
color:green;
"
>
'
+
val
+
'
%</
span
>
';
}
else
if
(val
<
0
){
return
'
<
span style
=
"
color:red;
"
>
'
+
val
+
'
%</
span
>
';
}
return
val;
}
//
create the data store
var
store
=
new
Ext.data.SimpleStore({
fields: [
{name: 'company'},
{name: 'price', type: '
float
'},
{name: 'change', type: '
float
'},
{name: 'pctChange', type: '
float
'},
{name: 'lastChange', type: 'date', dateFormat: 'n
/
j h:ia'}
]
});
store.loadData(myData);
//
create the Grid
var
grid
=
new
Ext.grid.GridPanel({
store: store,
columns: [
{id:'company',header:
"
Company
"
, width:
160
, sortable:
true
, dataIndex: 'company'},
{header:
"
Price
"
, width:
75
, sortable:
true
, renderer: 'usMoney', dataIndex: 'price'},
{header:
"
Change
"
, width:
75
, sortable:
true
, renderer: change, dataIndex: 'change'},
{header:
"
% Change
"
, width:
75
, sortable:
true
, renderer: pctChange, dataIndex: 'pctChange'},
{header:
"
Last Updated
"
, width:
85
, sortable:
true
, renderer: Ext.util.Format.dateRenderer('m
/
d
/
Y'), dataIndex: 'lastChange'}
],
stripeRows:
true
,
autoExpandColumn: 'company',
height:
350
,
width:
600
,
title:'Array Grid'
});
grid.render('grid
-
example');
grid.getSelectionModel().selectFirstRow();
});
posted on 2008-07-05 23:37
-274°C 阅读(12808)
评论(0) 编辑 收藏 所属分类:
web前端