#
作者:tacy lee
在应用使用过程中,我们经常会碰到应用响应时间很慢,甚至没有响应,但是应用服务器可能并不是很繁忙,cpu利用率也非常低,引起这种状况的原因有很多种,比如环境问题,应用资源泄漏,数据库原因等等,本文主要是从一次应用性能诊断过程来谈谈如何通过数据库诊断应用性能问题。
问题:
测试过程中发现应用中某个跳转页面执行时间比较长,系统压力不大,cpu利用很低,该页面需要从cache中取数据,第一次的时候加载cache(从数据库中查询回数据并cache)。
诊断:
页面逻辑比较简单,我们先用loadrunner模拟并发测试一下这个页面,然后再数据库端捕获sql执行情况。
1、打开db2监控开关
#db2 connect to eos

#db2 update monitor switches using statement on

#db2 reset monitor all
2、几分钟之后,我们收集sql统计快照
#db2 get snapshot for dynamic sql on eos > dysqlstatus.out
现在统计信息已经存放在dysqlstatus.out中,你可以使用任意方便的文本处理工具查看,我一般用windows上的gvim来处理,打开dysqlstatus.out
Number of executions               = 1

Number of compilations             = 1

Worst preparation time (ms)        = 2

Best preparation time (ms)         = 2

Internal rows deleted              = 0

Internal rows inserted             = 0

Rows read                          = 2

Internal rows updated              = 0

Rows written                       = 0

Statement sorts                    = 0

Statement sort overflows           = 0

Total sort time                    = 0

Buffer pool data logical reads     = Not Collected

Buffer pool data physical reads    = Not Collected

Buffer pool temporary data logical reads   = Not Collected

Buffer pool temporary data physical reads  = Not Collected

Buffer pool index logical reads    = Not Collected

Buffer pool index physical reads   = Not Collected

Buffer pool temporary index logical reads  = Not Collected

Buffer pool temporary index physical reads = Not Collected

Total execution time (sec.ms)      = 0.000377

Total user cpu time (sec.ms)       = 0.010000

Total system cpu time (sec.ms)     = 0.000000

Statement text                     = select ACTIVITYDEFID,ACTIVITYINSTID from wfworkitem  where PROCESSINSTID=104199 and CURRENTSTATE = 4


......
简单说一下vi中的处理
:g!/Total execution time/d

只保留文本中的sql执行时间,我们要按照执行时间来排序


通过vim的visual功能选择执行时间块(等号后面的数字),然后排序

Total execution time (sec.ms)      = 0.050590

Total execution time (sec.ms)      = 0.000170

Total execution time (sec.ms)      = 0.000247

Total execution time (sec.ms)      = 0.000292

Total execution time (sec.ms)      = 0.000474

Total execution time (sec.ms)      = 0.000330

Total execution time (sec.ms)      = 0.000348

Total execution time (sec.ms)      = 0.000279

Total execution time (sec.ms)      = 0.000385

Total execution time (sec.ms)      = 0.000296

Total execution time (sec.ms)      = 0.000261

Total execution time (sec.ms)      = 0.000195

Total execution time (sec.ms)      = 0.000226

Total execution time (sec.ms)      = 0.000227

Total execution time (sec.ms)      = 0.000193

......

:'<,'>!sort


排序后的结果(部分)

Total execution time (sec.ms)      = 2.027776

Total execution time (sec.ms)      = 2.203624

Total execution time (sec.ms)      = 2.504677

Total execution time (sec.ms)      = 2.951256

Total execution time (sec.ms)      = 3.119875

Total execution time (sec.ms)      = 3.303277

Total execution time (sec.ms)      = 3.303517

Total execution time (sec.ms)      = 4.017133

Total execution time (sec.ms)      = 4.043329

Total execution time (sec.ms)      = 4.252125

Total execution time (sec.ms)      = 4.400952

Total execution time (sec.ms)      = 4.606765

Total execution time (sec.ms)      = 5.208087

Total execution time (sec.ms)      = 5.778598

Total execution time (sec.ms)      = 8.117470

Total execution time (sec.ms)      = 9797.905136
可以看到最长时间的sql total执行时间耗费了3797.905123s.
现在我们到dysqlstatus.out中去找这条语句
Number of executions               = 4602

Number of compilations             = 4294967295

Worst preparation time (ms)        = 2

Best preparation time (ms)         = 2

Internal rows deleted              = 0

Internal rows inserted             = 0

Rows read                          = 2963688

Internal rows updated              = 0

Rows written                       = 0

Statement sorts                    = 0

Statement sort overflows           = 0

Total sort time                    = 0

Buffer pool data logical reads     = Not Collected

Buffer pool data physical reads    = Not Collected

Buffer pool temporary data logical reads   = Not Collected

Buffer pool temporary data physical reads  = Not Collected

Buffer pool index logical reads    = Not Collected

Buffer pool index physical reads   = Not Collected

Buffer pool temporary index logical reads  = Not Collected

Buffer pool temporary index physical reads = Not Collected

Total execution time (sec.ms)      = 9797.905136

Total user cpu time (sec.ms)       = 9.290000

Total system cpu time (sec.ms)     = 1.230000

Statement text                     = select * from XXXX_T_CNFACTIVITYDEF
这条语句总共执行了4602次,平均每次的执行时间2S,而且这些数据应该是被cache起来的 ;)
总结:
上面的方法简单总结了从数据库层面对应用的性能问题诊断,希望对大家有所帮助,对于数据库快照诊断问题的思路对于任意数据库通用
补充一个unix上脚本处理方式:
sqlsort.sh
awk 'BEGIN{RS="";FS="\n";ORS="\n"};/Statement text/{print $1, $21, $24}' $1 | awk '$5 > 0 {print "AvgTime:", $11/$5, "\t", $0}'| sort -n | head -n $2|awk '{print $0, "\n"}'
使用:#sqlsort.sh dysqlstate.out 10(显示Top ten)
作者:tacy lee
在应用中,我们经常会碰到sql执行很慢,但是数据库cpu和内存使用率又不高的情况,类似的问题基本上由于锁,排序等原因造成,本文主要描述如何去定位锁等待问题,谁在锁等待?等待谁持有的锁?锁在那个表?
一、测试准备
1、先在session1执行如下操作,创建测试表
#db2 connect to eos
#export DB2OPTIONS=+C
#db2 "create table tacy_test (a int not null primary key,b varchar(10))"
#db2 "insert into tacy_test values(1,'a')"
#db2 "insert into tacy_test values(2,'a')"
#db2 "insert into tacy_test values(3,'a')"
#db2 "insert into tacy_test values(4,'a')"
#db2 commit
2、在session2执行如下操作
#db2 connect to eos
#export DB2OPTIONS=+C
二、产生一个lock wait
在session1做一个表更新:
#db2 "update tacy_test set b='b' where a=4"
sql执行成功
在session2做同样更新操作:
#db2 "update tacy_test set b='c' where a=4"
进程被挂起等待
三、定位锁等待
1、先来看看应用的情况:
#db2pd -db eos -applications

Database Partition 0 -- Database EOS -- Active -- Up 0 days 07:37:37

Applications:
Address    AppHandl [nod-index] NumAgents  CoorPid    Status                  C-AnchID C-StmtUID  L-AnchID L-StmtUID  Appid
0x10140040 8        [000-00008] 1          8425       Lock-wait               80       2          66       1          *LOCAL.db2inst1.071124043739
0x100CE540 7        [000-00007] 1          8358       UOW-Waiting             0        0          80       2          *LOCAL.db2inst1.071124043708
可以看到有一个应用的状态处于Lock-wait
2、现在我们来看看应用在等什么
#db2pd -db eos -locks showlock wait

Database Partition 0 -- Database EOS -- Active -- Up 0 days 07:42:56

Locks:
Address    TranHdl    Lockname                   Type       Mode Sts Owner      Dur HldCnt     Att Rlse
0x2C8E0760 3          02001806078066020000000052 Row        ..X  W   2          1   0          0   0x0  TbspaceID 2 TableID 1560 RecordID 0x2668007
锁的类型为Row(行锁),X锁(排他锁),下面是我们最关心的锁的位置
TbspaceID 2 TableID 1560 RecordID 0x2668007
其中TbspaceID为表空间ID,TableID为表的ID,RecordID代表具体位置,全部应该是0x0266807,其中前面三个字节为page number,为0x02668,后面一个字节代表solt identifier,为0x07
3、找到相应的表
#db2 "select tbspace,tabschema,tabname,tableid,tbspaceid from syscat.tables where tbspaceid=2 and tableid=1560"

TBSPACE       TABSCHEMA   TABNAME    TABLEID TBSPACEID
------------  ----------- ---------- ------- ---------
USERSPACE1    DB2INST1    TACY_TEST     1560         2

  1 record(s) selected.
4、根据RecordID找到锁在哪行
db2提供了一个强大的数据分析工具db2dart,可以dump出相应的page数据
#db2dart eos /dd /tsi 2 /oi 1560 /ps 157312p /np 1 /v y

Warning: The database state is not consistent.

Warning: Reorg rows MAY be due to the inconsistent state of the database.
                  DB2DART Processing completed with warning(s)!
                        Complete DB2DART report found in:
/home/db2inst1/sqllib/db2dump/DART0000/EOS.RPT
其中tsi为表空间id(2),oi为表id(1560),ps为page number(0x0266807),需要转换为十进制,在结尾必须加p,np代表你要获取的页数,v为是否详细输出
现在我们来看看EOS.RPT
______________________________________________________________________________

        _______                    DART                   _______

   D a t a b a s e   A n a l y s i s   a n d   R e p o r t i n g   T o o l

                           IBM    DB2    6000
______________________________________________________________________________

DART (V8.1.0)  Report:
2007-11-24-20.59.51.355893

            Database Name: EOS
            Report name: EOS.RPT
            Old report back-up: EOS.BAK
            Database Subdirectory: /opt/db2/db2inst1/NODE0000/SQL00001
            Operational Mode: Database Inspection Only (INSPECT)

______________________________________________________________________________
------------------------------------------------------------------------------


Action option: DD
Table-object-ID: 1560; Tablespace-ID: 2; First-page: 157312p; Number-pages: 1; Verbose: y

Warning: The database state is not consistent.

Warning: Reorg rows MAY be due to the inconsistent state of the database.
Connecting to Buffer Pool Services...

   Table object report phase start.
   Dump format is verbose.

                           ______________________________________

         Page 0 of object 1560 from table space 2.

         BPS Page Header:

                     Page Data Offset = 48
                     Page Data Length = 4048
                             Page LSN = 0000 AE97 AE41
                   Object Page Number = 0
                     Pool Page Number = 157312
                            Object ID = 1560
                          Object Type = Data Object

               Data Page Header:

                           Slot Count = 8
                     Total Free Space = 2784
                  Total Reserve Space = 0
               Youngest Reserve Space = n/a
                         Youngest TID = n/a
                    Free Space Offset = 2799
                  Maximum Record Size = 23

               Data Records:


            Slot 0:

               Offset Location = 3996  (xF9C)
               Record Length = 32  (x20)

               Record Type = Data Object Header Control Record

                  Page count = 1
         Object Creation LSN = 0000 AE97 800C
                Object State = x0000
          UDI Since Runstats = 0
                  DART Field = x00000000

            Slot 1:

               Offset Location = 2992  (xBB0)
               Record Length = 1004  (x3EC)

               Record Type = Free Space Control Record

               Free space entries:
                 0:  2884 (x0B44),  4028 (x0FBC),  4028 (x0FBC),  4028 (x0FBC)
                 4:  4028 (x0FBC),  4028 (x0FBC),  4028 (x0FBC),  4028 (x0FBC)
                 8:  4028 (x0FBC),  4028 (x0FBC),  4028 (x0FBC),  4028 (x0FBC)
               省略。。。
                  492:  4028 (x0FBC),  4028 (x0FBC),  4028 (x0FBC),  4028 (x0FBC)
                  496:  4028 (x0FBC),  4028 (x0FBC),  4028 (x0FBC),  4028 (x0FBC)

            Slot 2:

               Offset Location = 2916  (xB64)
               Record Length = 76  (x4C)

               Record Type = Table Directory Record

                  MetaIndex Root Page = 157377
                  Index Type = 2
                  Table Descriptor Pointer  --  Page 157312  Slot 3
                  Max Insert Search = 0
                  Flags = x02000200
                     bit representation = 00000010 00000000 00000010 00000000
                  Check pending info:
                     Constraint status    = x00
                     Constraint RID       = Page 0 Slot 0
                     last BID          = x00000000

            Slot 3:

               Offset Location = 2892  (xB4C)
               Record Length = 24  (x18)

               Record Type = Table Description Record

                  Number of Columns = 2


                  Column 1:
                  Type is Long Integer
                  Length = 4
                  Prohibits NULLs
                  Prohibits Default
            Fixed offset: 0

                  Column 2:
                  Type is Fixed Length Character String
                  Length = 10
                  Allows NULLs
                  Prohibits Default
            Fixed offset: 4

            Slot 4:

               Offset Location = 2869  (xB35)
               Record Length = 23  (x17)

               Record Type = Table Data Record (FIXEDVAR)

               Fixed part length value = 15

                  Column 1:
            Fixed offset: 0
                  Type is Long Integer
                  Value = 1

                  Column 2:
            Fixed offset: 4
                  Type is Fixed Length Character String
                      61202020 20202020 2020                 a


            Slot 5:

               Offset Location = 2846  (xB1E)
               Record Length = 23  (x17)

               Record Type = Table Data Record (FIXEDVAR)

               Fixed part length value = 15

                  Column 1:
            Fixed offset: 0
                  Type is Long Integer
                  Value = 2

                  Column 2:
            Fixed offset: 4
                  Type is Fixed Length Character String
                      61202020 20202020 2020                 a


            Slot 6:

               Offset Location = 2823  (xB07)
               Record Length = 23  (x17)

               Record Type = Table Data Record (FIXEDVAR)

               Fixed part length value = 15

                  Column 1:
            Fixed offset: 0
                  Type is Long Integer
                  Value = 3

                  Column 2:
            Fixed offset: 4
                  Type is Fixed Length Character String
                      61202020 20202020 2020                 a


            Slot 7:

               Offset Location = 2800  (xAF0)
               Record Length = 23  (x17)

               Record Type = Table Data Record (FIXEDVAR)

               Fixed part length value = 15

                  Column 1:
            Fixed offset: 0
                  Type is Long Integer
                  Value = 4

                  Column 2:
            Fixed offset: 4
                  Type is Fixed Length Character String
                      61202020 20202020 2020                 a


         Slots Summary:  Total=8,  In-use=8,  Deleted=0.


   Table object report phase end.
                     ______________________________________

                  DB2DART Processing completed with warning(s)!
                     Warning(s) detected during processing.
                     ______________________________________

                        Complete DB2DART report found in:
/home/db2inst1/sqllib/db2dump/DART0000/EOS.RPT
    _______    D A R T    P R O C E S S I N G    C O M P L E T E    _______
找到Solt 7 (0x07),ok,你现在可以清楚的知道应用等待的Row为(4,a)
总结
通过上面的方法,我们简单描述了一个db2锁问题的定位方法,希望能给大家在分析和定位应用性能问题的时候起到一定的帮助
作者:tacy lee
一:基本介绍
在Loadrunner的使用中,对于Run-time Settings下的browser emulation设置是比较容易让人产生困惑的地方。下面我们结合sniffer来具体看看每个选项的用途,以及对测试的影响。
Browser Emulation 图
二:案例和工具
1. 测试案例:
打开网站首页两次,对比不同Browser Emulation设置下loadrunner的行为,脚本如下。
Action()
{
    web_url("www.primeton.com",
        "URL=http://www.primeton.com/",
        "Resource=0",
        "RecContentType=text/html",
        "Referer=",
        "Snapshot=t2.inf",
        "Mode=HTML",
        LAST);

    web_url("www.primeton.com",
        "URL=http://www.primeton.com/",
        "Resource=0",
        "RecContentType=text/html",
        "Referer=",
        "Snapshot=t2.inf",
        "Mode=HTML",
        LAST);

    return 0;
}
2. sniffer工具
开源工具:Wireshark(前身是ethereal)(www.wireshark.org)
三:测试过程
为了方便描述,我们约定用:
A代表Simulate browser cache
B代表Cache URLs requiring content(HTMLs)
C代表Check for newer versions of stored pages every visit to the page
D代表Download non-HTML resources
E代表Simulate a new user on each iteratioin
F代表Clear cache on each iteration
首先设置Run Logic中的iteration为2。让Action运行两次,看看循环运行脚本两次,数据包和连接数的变化。
1. 去掉所有选项
结果:共获取数据包95个,建立连接1个(红色标识),断开连接1个(蓝色标识)
No.     Time        Source            Destination       Protocol Info
      1 0.000000    192.168.1.61      203.81.29.137     TCP      13835 > http [SYN] Seq=0 Len=0 MSS=1460 WS=2
      2 0.036053    203.81.29.137     192.168.1.61      TCP      http > 13835 [SYN, ACK] Seq=0 Ack=1 Win=17280 Len=0 MSS=1440 WS=0
     92 1.415887    192.168.1.61      203.81.29.137     TCP      13835 > http [FIN, ACK] Seq=817 Ack=71762 Win=257760 Len=0
     94 1.449960    203.81.29.137     192.168.1.61      TCP      http > 13835 [FIN, ACK] Seq=71762 Ack=818 Win=16464 Len=0
在这种情况下,数据包非常少(没有选择下载资源文件入css,js,gif等),而且你可以看到,打开4次首页,只建立了一个tcp连接。
这时,你即使选择A,发现数据包的数量量页没有变化,因为cache主要还是针对资源文件
2. 选择E(F)
结果:共获取数据包102个,建立连接2个(红色标识),断开连接2个(蓝色标识)
No.     Time        Source            Destination       Protocol Info
      1 0.000000    192.168.1.61      203.81.29.137     TCP      13886 > http [SYN] Seq=0 Len=0 MSS=1460 WS=2
      2 0.037013    203.81.29.137     192.168.1.61      TCP      http > 13886 [SYN, ACK] Seq=0 Ack=1 Win=17280 Len=0 MSS=1440 WS=0
     48 0.618117    192.168.1.61      203.81.29.137     TCP      13886 > http [FIN, ACK] Seq=409 Ack=35882 Win=257760 Len=0
     49 0.644106    192.168.1.61      203.81.29.137     TCP      13887 > http [SYN] Seq=0 Len=0 MSS=1460 WS=2
     51 0.651919    203.81.29.137     192.168.1.61      TCP      http > 13886 [FIN, ACK] Seq=35882 Ack=410 Win=16872 Len=0
     53 0.676377    203.81.29.137     192.168.1.61      TCP      http > 13887 [SYN, ACK] Seq=0 Ack=1 Win=17280 Len=0 MSS=1440 WS=0
     99 1.310379    192.168.1.61      203.81.29.137     TCP      13887 > http [FIN, ACK] Seq=409 Ack=35882 Win=257760 Len=0
101 1.347949    203.81.29.137     192.168.1.61      TCP      http > 13887 [FIN, ACK] Seq=35882 Ack=410 Win=16872 Len=0
在这种情况下,数据包非常少(没有选择下载资源文件入css,js,gif等),对比第一种情况,你会发现它建立了两个连接,这就是E的作用,它对于每次迭代都当成一个新的用户,需要重新建立连接。
3. 选择DE(F)
结果:共获取数据包1782个,建立连接6个(红色标识),断开连接6个(蓝色标识)
No.     Time        Source            Destination       Protocol Info
      1 0.000000    192.168.1.61      203.81.29.137     TCP      14016 > http [SYN] Seq=0 Len=0 MSS=1460 WS=2
      2 0.037911    203.81.29.137     192.168.1.61      TCP      http > 14016 [SYN, ACK] Seq=0 Ack=1 Win=17280 Len=0 MSS=1440 WS=0
      6 0.107432    192.168.1.61      203.81.29.137     TCP      14017 > http [SYN] Seq=0 Len=0 MSS=1460 WS=2
      9 0.141816    203.81.29.137     192.168.1.61      TCP      http > 14017 [SYN, ACK] Seq=0 Ack=1 Win=17280 Len=0 MSS=1440 WS=0
    426 3.334889    192.168.1.61      203.81.29.137     TCP      14017 > http [FIN, ACK] Seq=1852 Ack=150284 Win=257484 Len=0
    428 3.372253    203.81.29.137     192.168.1.61      TCP      http > 14017 [FIN, ACK] Seq=150284 Ack=1853 Win=16998 Len=0
    448 4.395488    192.168.1.61      203.81.29.137     TCP      14020 > http [SYN] Seq=0 Len=0 MSS=1460 WS=2
    457 4.439604    203.81.29.137     192.168.1.61      TCP      http > 14020 [SYN, ACK] Seq=0 Ack=1 Win=17280 Len=0 MSS=1440 WS=0
    859 7.593610    192.168.1.61      203.81.29.137     TCP      14016 > http [FIN, ACK] Seq=2849 Ack=377404 Win=257484 Len=0
    870 7.659680    203.81.29.137     192.168.1.61      TCP      http > 14016 [FIN, ACK] Seq=377404 Ack=2850 Win=15935 Len=0
    888 8.511308    192.168.1.61      203.81.29.137     TCP      14020 > http [FIN, ACK] Seq=1602 Ack=208150 Win=257760 Len=0
    890 8.549451    203.81.29.137     192.168.1.61      TCP      http > 14020 [FIN, ACK] Seq=208150 Ack=1603 Win=17280 Len=0
    892 8.566246    192.168.1.61      203.81.29.137     TCP      14022 > http [SYN] Seq=0 Len=0 MSS=1460 WS=2
    893 8.601893    203.81.29.137     192.168.1.61      TCP      http > 14022 [SYN, ACK] Seq=0 Ack=1 Win=17280 Len=0 MSS=1440 WS=0
    899 8.702628    192.168.1.61      203.81.29.137     TCP      14023 > http [SYN] Seq=0 Len=0 MSS=1460 WS=2
    904 8.741807    203.81.29.137     192.168.1.61      TCP      http > 14023 [SYN, ACK] Seq=0 Ack=1 Win=17280 Len=0 MSS=1440 WS=0
   1298 11.809456   192.168.1.61      203.81.29.137     TCP      14022 > http [FIN, ACK] Seq=1550 Ack=159770 Win=257484 Len=0
   1310 11.878665   203.81.29.137     192.168.1.61      TCP      http > 14022 [FIN, ACK] Seq=159770 Ack=1551 Win=17280 Len=0
   1341 12.771707   192.168.1.61      203.81.29.137     TCP      14026 > http [SYN] Seq=0 Len=0 MSS=1460 WS=2
   1348 12.813950   203.81.29.137     192.168.1.61      TCP      http > 14026 [SYN, ACK] Seq=0 Ack=1 Win=17280 Len=0 MSS=1440 WS=0
   1759 16.032952   192.168.1.61      203.81.29.137     TCP      14023 > http [FIN, ACK] Seq=3151 Ack=367918 Win=257484 Len=0
   1761 16.068296   203.81.29.137     192.168.1.61      TCP      http > 14023 [FIN, ACK] Seq=367918 Ack=3152 Win=17280 Len=0
   1779 16.983042   192.168.1.61      203.81.29.137     TCP      14026 > http [FIN, ACK] Seq=1602 Ack=208150 Win=257760 Len=0
   1781 17.016836   203.81.29.137     192.168.1.61      TCP      http > 14026 [FIN, ACK] Seq=208150 Ack=1603 Win=17280 Len=0
在这种情况下,数据包的数量非常大,连接也很多,由于没有cache功能,每次打开页面都需要重新下载所有的资源文件。
4. 选择ADE
结果:共获取数据包525个,建立连接3个,断开连接3个(不再标识了,syn即为连接请求,fin即为断开请求)
No.     Time        Source            Destination       Protocol Info
      1 0.000000    192.168.1.61      203.81.29.137     TCP      14189 > http [SYN] Seq=0 Len=0 MSS=1460 WS=2
      2 0.033657    203.81.29.137     192.168.1.61      TCP      http > 14189 [SYN, ACK] Seq=0 Ack=1 Win=17280 Len=0 MSS=1440 WS=0
      6 0.100636    192.168.1.61      203.81.29.137     TCP      14190 > http [SYN] Seq=0 Len=0 MSS=1460 WS=2
      9 0.133703    203.81.29.137     192.168.1.61      TCP      http > 14190 [SYN, ACK] Seq=0 Ack=1 Win=17280 Len=0 MSS=1440 WS=0
    429 3.383748    192.168.1.61      203.81.29.137     TCP      14190 > http [FIN, ACK] Seq=1852 Ack=150284 Win=257484 Len=0
    431 3.418556    203.81.29.137     192.168.1.61      TCP      http > 14190 [FIN, ACK] Seq=150284 Ack=1853 Win=16998 Len=0
    471 4.352071    192.168.1.61      203.81.29.137     TCP      14189 > http [FIN, ACK] Seq=1504 Ack=235576 Win=257760 Len=0
    472 4.380312    192.168.1.61      203.81.29.137     TCP      14192 > http [SYN] Seq=0 Len=0 MSS=1460 WS=2
    474 4.389778    203.81.29.137     192.168.1.61      TCP      http > 14189 [FIN, ACK] Seq=235576 Ack=1505 Win=17280 Len=0
    476 4.413220    203.81.29.137     192.168.1.61      TCP      http > 14192 [SYN, ACK] Seq=0 Ack=1 Win=17280 Len=0 MSS=1440 WS=0
    522 5.078068    192.168.1.61      203.81.29.137     TCP      14192 > http [FIN, ACK] Seq=409 Ack=35882 Win=257760 Len=0
524 5.115099    203.81.29.137     192.168.1.61      TCP      http > 14192 [FIN, ACK] Seq=35882 Ack=410 Win=16872 Len=0
在这种情况下,cache发挥作用,数据包对比第三种情况大大减少,几乎等于打开一次首页的数据量(449个数据包),只有第一次打开页面需要完整下载页面(包括资源文件),后面的三次打开页面都只要下载HTML页面(不包括资源文件)。
5. 选择ADEF
选择F之后我们看看结果:共获取数据包942个,建立连接4个,断开连接4个
No.     Time        Source            Destination       Protocol Info
      1 0.000000    192.168.1.61      203.81.29.137     TCP      14292 > http [SYN] Seq=0 Len=0 MSS=1460 WS=2
      2 0.034524    203.81.29.137     192.168.1.61      TCP      http > 14292 [SYN, ACK] Seq=0 Ack=1 Win=17280 Len=0 MSS=1440 WS=0
      6 0.102314    192.168.1.61      203.81.29.137     TCP      14294 > http [SYN] Seq=0 Len=0 MSS=1460 WS=2
      9 0.139752    203.81.29.137     192.168.1.61      TCP      http > 14294 [SYN, ACK] Seq=0 Ack=1 Win=17280 Len=0 MSS=1440 WS=0
    426 3.791111    192.168.1.61      203.81.29.137     TCP      14294 > http [FIN, ACK] Seq=1852 Ack=150284 Win=257484 Len=0
    428 3.824970    203.81.29.137     192.168.1.61      TCP      http > 14294 [FIN, ACK] Seq=150284 Ack=1853 Win=16998 Len=0
    468 6.213276    192.168.1.61      203.81.29.137     TCP      14292 > http [FIN, ACK] Seq=1504 Ack=235576 Win=257760 Len=0
    469 6.244052    192.168.1.61      203.81.29.137     TCP      14297 > http [SYN] Seq=0 Len=0 MSS=1460 WS=2
    471 6.249564    203.81.29.137     192.168.1.61      TCP      http > 14292 [FIN, ACK] Seq=235576 Ack=1505 Win=17280 Len=0
    473 6.279647    203.81.29.137     192.168.1.61      TCP      http > 14297 [SYN, ACK] Seq=0 Ack=1 Win=17280 Len=0 MSS=1440 WS=0
    479 6.374967    192.168.1.61      203.81.29.137     TCP      14298 > http [SYN] Seq=0 Len=0 MSS=1460 WS=2
    484 6.419597    203.81.29.137     192.168.1.61      TCP      http > 14298 [SYN, ACK] Seq=0 Ack=1 Win=17280 Len=0 MSS=1440 WS=0
    897 9.858493    192.168.1.61      203.81.29.137     TCP      14297 > http [FIN, ACK] Seq=1550 Ack=159770 Win=257484 Len=0
    899 9.895188    203.81.29.137     192.168.1.61      TCP      http > 14297 [FIN, ACK] Seq=159770 Ack=1551 Win=17280 Len=0
    939 12.840029   192.168.1.61      203.81.29.137     TCP      14298 > http [FIN, ACK] Seq=1806 Ack=226090 Win=257760 Len=0
    941 12.876120   203.81.29.137     192.168.1.61      TCP      http > 14298 [FIN, ACK] Seq=226090 Ack=1807 Win=17076 Len=0
在这种情况下,由于选择了F,在迭代的时候清除了cache,所以每次迭代都需要重新下载资源文件。数据包差不多等于第三种情况的一半,约等于打开两次首页的数据量(449×2个数据包)。
6. 关于BC选项
C的解释(Check for newer versions of stored pages every visit to the page)
C比较容易理解,类似IE设置中的每次检查,如果不设置C,LR对于已经cache的文件就不会重新向服务器请求,如果选择C,你就可以在数据包中发现很多304信息。
B的解释(Cache URLs requiring content(HTMLs))
LR对于资源文件的cache并不会真正cache在内存中或者在磁盘上,这个选项表示:对于一些需要用到的关联,校验,页面解析内容真正cache在内存中,减少客户端的重复工作。
当然如果你想把GIF也cache到内存中,你可以在Advanced中设置,选择Specify URL requiring content in addition to HTML pages,加入条目image/gif,并勾选。当Vuser运行的时候,你可以对比一下mmdrv.exe进程的内存消耗(内存占用会更多)。
四: 结论
通过上面的测试分析,我们大概知道了每个选项的真正含义,你需要根据你的测试目的来选择合适的设置:
1、 对于一个具体的应用测试,对于前端Web Server不可忽略,缺省设置非常合适,不需要调整(有时候需要考虑把C选上)
注意:很多人在录制脚本的时候,习惯把登入操作放到vuser_init中,这时候缺省设置可能会抛错,建议把这类的操作都放入到action中
2、 如果你更关注后端应用服务器的性能或者说做一些架构的验证分析,那你缺省设置对于你来说就不合适了,你需要选择取消所有的设置项。
当然你也可以根据自己的具体情况做不同调整,但是一定要真正理解这些选项的具体含义才能做到不犯错误
编译的时候出现java抛如下异常:
java.nio.BufferOverflowException
at java.nio.Buffer.nextPutIndex(Buffer.java:419)
at java.nio.HeapCharBuffer.put(HeapCharBuffer.java:145)
at com.sun.tools.javac.parser.Scanner.decode(Scanner.java:405)
at com.sun.tools.javac.parser.Scanner.<init>(Scanner.java:304)
at com.sun.tools.javac.parser.Scanner.<init>(Scanner.java:238)
at com.sun.tools.javac.parser.Scanner$Factory.newScanner(Scanner.java:72)
at com.sun.tools.javac.main.JavaCompiler.parse(JavaCompiler.java:254)
at com.sun.tools.javac.main.JavaCompiler.parse(JavaCompiler.java:281)
at com.sun.tools.javac.main.JavaCompiler.compile(JavaCompiler.java:399)
at com.sun.tools.javac.main.Main.compile(Main.java:592)
at com.sun.tools.javac.main.Main.compile(Main.java:544)
at com.sun.tools.javac.Main.compile(Main.java:67)
at sun.reflect.NativeMethodAccessorImpl.invoke0(Native Method)
at sun.reflect.NativeMethodAccessorImpl.invoke(NativeMethodAccessorImpl.java:39)
at sun.reflect.DelegatingMethodAccessorImpl.invoke(DelegatingMethodAccessorImpl.java:25)
at java.lang.reflect.Method.invoke(Method.java:585)
at org.apache.tools.ant.taskdefs.compilers.Javac13.execute(Javac13.java:55)
at org.apache.tools.ant.taskdefs.Javac.compile(Javac.java:936)
at org.apache.tools.ant.taskdefs.Javac.execute(Javac.java:758)
at org.apache.tools.ant.UnknownElement.execute(UnknownElement.java:275)
at org.apache.tools.ant.Task.perform(Task.java:364)
at org.apache.tools.ant.Target.execute(Target.java:341)
at org.apache.tools.ant.Target.performTasks(Target.java:369)
at org.apache.tools.ant.Project.executeTarget(Project.java:1214)
at com.primeton.studio.compile.java.bizlets.BizletProcessor.startAnt(BizletProcessor.java:327)
at com.primeton.studio.compile.java.bizlets.BizletProcessor.prepareclass(BizletProcessor.java:419)
at com.primeton.studio.compile.java.bizlets.BizletProcessor.init(BizletProcessor.java:374)
at com.primeton.studio.compile.java.bizlets.BizletProcessor.build(BizletProcessor.java:130)
at com.primeton.studio.compile.frame.ProjectProcessor.buildBizlets(ProjectProcessor.java:161)
at com.primeton.studio.compile.frame.ProjectProcessor.build(ProjectProcessor.java:115)
at com.primeton.studio.compile.frame.SimpleBuilder.build(SimpleBuilder.java:195)
at com.primeton.studio.compile.frame.SimpleBuilder.build(SimpleBuilder.java:182)
at com.primeton.studio.compile.frame.SimpleBuilder.main(SimpleBuilder.java:265)
查了一下,估计是java采用gbk字符集(缺省windows的中文字符集),导致stack区溢出(明显没对国际化测试不足嘛)
解决问题的方法就是修改系统的缺省区域设置为English既可。
del.icio.us Tags:
java ,
ant ,
build ,
tips
故障现象:
测试一段时间后应用无响应,连接池不能放大,jvm crash,日志报对象分配失败
问题诊断:
第一个阶段是websphere问题
到现场之后,回放脚本测试几分钟,应用开始无法响应,后台也没有异常,update jdk之后,系统能正常响应了,但是发现新的问题,db2连接池始终无法放大,最大只能到30,而且系统也会抛OOM,导致系统异常推出,从系统日志看,是因为应用中的大对象分配导致的(2M大小)
期间,关于连接池无法放大问题想了很多办法,包括修改db2 maxappls,maxagents这些参数,更新数据库驱动,而且确定不是db2的问题(在创建30之后,我们依然可以通过其他方式连接到db2,说明db2的连接限制确实放大了),当然我们productdatasource这个池子大小我已经放大到100了。
中间还发现测试脚本没有正常启动流程,排查后发现是loadrunner的问题,用我机器上的lr录制正常(错误代码提示是字段长度限制,莫名其妙)。
关于jvm crach我们也调整了heap设置:-xms256m,-xmx1536m
但是问题依然存在。后面我们重新安装了应用,所有的设置采用缺省配置,没有打任何补丁,系统这个时候竟然可以正常跑了,只是响应很慢,而且时间曲线一直往上抛(测试一段时间系统无响应)
查了一下配置,发现productdatasource的缺省设置竟然就是30,这个时候基本判断是之前的websphere的设置修改没有生效
重新修改jvm和连接池配置,这时候系统正常,数据连接也达到83个,然后开始测试大并发量
阶段二就是调整数据库配置
1、第一个是db2 default buffer pool,缺省配置buffer才4m,这个一定要注意修改
2、第二个是db2的lock数量,在缺省基础上好像放大了100倍
3、sort heap,排序区(防止排序溢出)
这些调整都要通过db2的状态来调整,可以通过get snapshot指令来获得数据库状态,buffer不够会出现大量的逻辑读,lock不够会抛lock溢出(会导致锁升级),sort heap不够会提示排序溢出(这时候排序会在硬盘做)
回头看看这次支持:
1、websphere配置修改不生效,我后面仔细想了想,这个websphere很多公司用可能大家都乱改了一通,另一问题是我们的使用习惯,websphere强烈不建议用kill直接杀进程方式停服务器,websphere不但是一个java进程,还有很多的附属进程,直接kill也很容易导致websphere不正常
2、jvm crach问题,这个我建议大家看看这篇文档http://www-1.ibm.com/support/docview.wss?rs=180&context=SSEQTP&q1=fragmentation
&uid=swg21176363&loc=en_US&cs=utf-8&lang=en
如何去定位jvm问题,首先看nativerr.log日志,如果出现OOM,这里会有记录,当发现OOM的时候,可以打开jvm的verbosegc,分析verbosegc和jvm dump file,上面文档里提到一个很重要的东西就是pinned对象,这也是ibm为啥不建议设置ms=mx的原因。
先建立一个监控器
db2 "create event monitor SQLCOST for statements write to file '/home/db2inst1'"
再设置事务状态为打开
db2 "set event monitor SQLCOST state=1"
注:1为打开,0为关闭,收集数据之后,记得关闭你的监控器,否则。。。
跑你的测试后,在你的/home/db2inst1目录下会生成一些evm文件
用下面指令获取诊断信息:
db2evmon -db eos51 -evm SQLCOST>sqlcost1.txt
完成之后删除你的监控器
db2 "drop event monitor SQLCOST"
生成的采样例子,从下面的例子中,你可以清除的看到SQL执行的时间,CPU消耗情况,排序是否溢出,BufferPool的使用情况,根据这些信息,SQL的执行效率一目了然:
26) Statement Event ...
Appl Handle: 336
Appl Id: C0A80421.O905.0ABDA5065446
Appl Seq number: 0657
Record is the result of a flush: FALSE
-------------------------------------------
Type : Dynamic
Operation: Execute
Section : 7
Creator : NULLID
Package : SYSSN300
Consistency Token : SYSLVL01
Package Version ID :
Cursor : SQL_CURSN300C7
Cursor was blocking: FALSE
Text : update WFProcessInst set relateData=? where processInstID= ?
-------------------------------------------
Start Time: 04/25/2007 14:57:19.402248
Stop Time: 04/25/2007 14:57:19.409622
Exec Time: 0.007374 seconds
Number of Agents created: 1
User CPU: 0.000000 seconds
System CPU: 0.000000 seconds [licl1]
Fetch Count: 0
Sorts: 0
Total sort time: 0
Sort overflows: 0 [licl2]
Rows read: 1
Rows written: 1
Internal rows deleted: 0
Internal rows updated: 0
Internal rows inserted: 0
Bufferpool data logical reads: 9
Bufferpool data physical reads: 0
Bufferpool temporary data logical reads: 0
Bufferpool temporary data physical reads: 0
Bufferpool index logical reads: 3
Bufferpool index physical reads: 0
Bufferpool temporary index logical reads: 0
Bufferpool temporary index physical reads: 0 [licl3]
SQLCA:
sqlcode: 0
sqlstate: 00000
[licl1]SQL执行时间和CPU消耗情况
[licl2]SQL的排序情况,可以看到这个SQL没有排序,当然也没有排序溢出
[licl3]Bufferpool的使用情况,逻辑读和物理读的对比
del.icio.us Tags:
database ,
db2 ,
tuning
作者:tacy lee
简单介绍一下Loadrunner Analysis中的Web Page Diagnostics模块的使用,很多人对于测试之后的结果数据分析摸不着头脑,其实loadrunner Analysis给你提供了很好的文档,大家没事可以多翻翻,多翻几遍对于性能测试你就入门了 ;)
Web Page Diagnostics (以下简称WPD),这是LR Analysis中非常重要的一块,搞清楚这部分的内容会让你少走很多弯路,很多环境问题都可以通过它来定位,比如客户端,网络。通过它可以你可以比较好的来定位是环境的问题还是应用本身的问题,当然更重要的是Web页面本身的问题。
WPD包括下面几个图表:
Web Page Diagnostics 这是张总图,包括下面几张Over Time图的内容
Page Component Breakdown 页面中每个元素的平均响应时间占整个页面响应时间的百分比
Page Component Breakdown(Over Time) 在整个测试过程中,任意一秒内页面中每个元素的响应时间(例如在runtime中设置了browser cache,页面中的资源文件就只会在第一次下载,后面的页面响应时间也就不包括这些元素的时间,这在Page Component Breakdown中是看不出来的,因为Page Component Breakdown是整个测试期间内的平均时间。当然,是否启用了cache,通过over time图就能看出来)
Page Download Time Breakdown 页面中每个元素的响应时间分割图,响应时间被分割为以下几个部分:DNS Resolution,Connection,First Buffer,SSL Handshaking,Receive,FTP Authentication,Client,Error
Page Download Time Breakdown(Over Time) 在整个测试过程中,任意一秒内页面中每个元素的响应时间分割图
Time to First Buffer Breakdown First Buffer Time时间分割为Network Time和Server Time,客户端http请求发送到接收到服务器端的应答包(ACK)为Network Time,从接收到ACK到完成First Buffer接受为Server Time
Time to First Buffer Breakdown(Over Time) 基本同上,任意一秒内的
Downloaded Component Size(KB) 页面中每个元素的大小(KB)
介绍了这么多,具体如何分析呢?
首先打开Web Page Diagnostics图,来看看下面一个例子Download Time图:
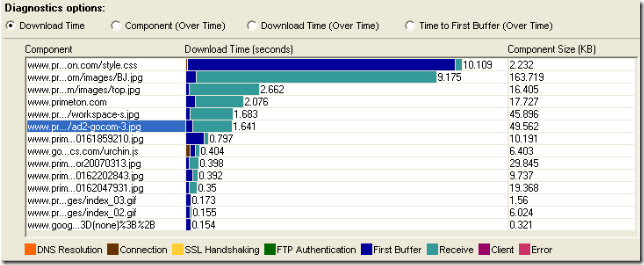
上图存在两个问题:
1、receive时间很长
这个一般是网络问题,当然如果你确认网络不存在问题,那么你就要看看是不是客户端的问题(客户端也可能会造成Receive过长,这个千万要注意)
2、页面问题
页面上包括了非常多的图片,而且图片似乎都没有优化,最大的竟然有163K,记下来,这可是罪证哦 ;)
很多时候,你可以根据DNS,Connection,Receive来看出是否存在网络问题,根据Client来判断是否存在客户端问题。
看看,挺简单的吧! ^_^
换个图看看,Page Component Breakdown(Over Time)
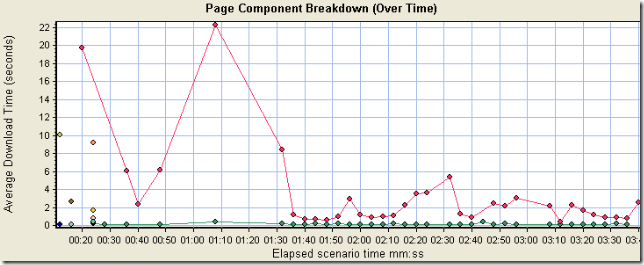
很清楚吧,页面元素都被cache了,说明场景启用了browser cache,页面的响应时间只包括红线和蓝线。
Time to First Buffer Breakdown(Over Time) ,图就不贴了,这个图非常重要,也最复杂,这里的值不绝对,当网络状况不好的时候,server time很可能包括网络时间,因为很多页面元素比较小(小于4k的样子),在First Buffer就完成传输,所以一定要注意分析。
就唠叨到这里吧,欢迎拍砖
昆汀.塔伦蒂诺,血浆爱好者
剧情简单,却能让你血脉贲张,当然你要先忍受昆汀的一贯喋喋不休,听得我昏昏欲睡,打算回头再过一遍
怀旧风格的影像处理,火辣的大腿舞,血腥的撞车镜头(喜欢kill bill的tx应该是见怪不怪了),极速飚车,拳头,极度亢奋的表扬和精彩的配乐(原声大碟不要错过),如果你喜欢这些,so...
罗伯特.罗德里格斯的恐怖星球俺不太喜欢,和他之前拍的罪恶之城没法比,如果你是cult爱好者,看看吧,断腿机枪比较牛叉
刑房GRINDHOUSE:是指专门放映exploitation films的小影院,exploitation films也被称作grindhouse films,昆汀和罗伯特的这部片子也是一部怀旧的exploitation film,熟悉他们两个经历的可能知道,他们都是在这类电影的熏陶下长大的,并且是狂热的爱好者,从他们之前拍摄的电影就可以看出
Exploitation film is a type of film that eschews the expense of "quality" productions in favor of making films on-the-cheap, attracting the public by exciting their more prurient interests. "Exploitation" is the show business term for promotion, and an exploitation film is one which relies heavily on the lurid advertising of its contents, rather than the intrinsic quality of the film.
Exploitation films feature forbidden sex, wanton violence, drug use, nudity, freaks, gore, monsters, destruction, rebellion and mayhem. Such films have existed since the earliest days of moviemaking, but they were popularized in the 1960s with the general relaxing of cinematic taboos in the U.S. and Europe. Since the 1990s, this genre has also received attention from academic circles, where it is sometimes called paracinema.
Ephraim Katz, author of The Film Encyclopedia, has defined exploitation as:
Films made with little or no attention to quality or artistic merit but with an eye to a quick profit, usually via high-pressure sales and promotion techniques emphasizing some sensational aspect of the product
del.icio.us Tags:
life ,
movie
作者:tacy lee
<container-descriptor>
servlet-reload-check-secs
The <servlet-reload-check-secs> element defines whether a WebLogic Server will check to see if a servlet has been modified, and if it has been modified, reloads it.
-
The value -1 means never check the servlets. This is the default value in a production environment.
-
The value 0 means always check the servlets.
-
The value 1 means check the servlets every second. This is the default value in a development environment.
A value specified in the console will always take precedence over a manually specified value.
resource-reload-check-secs
The <resource-reload-check-secs> element is used to perform metadata caching for cached resources that are found in the resource path in the Web application scope. This parameter identifies how often WebLogic Server checks whether a resource has been modified and if so, it reloads it.
-
The value -1 means metadata is cached but never checked against the disk for changes. In a production environment, this value is recommended for better performance.
-
The value 0 indicates not to do any metadata caching. Customers who keep changing their files must set this parameter to a value greater than or equal to 0.
-
The value 1 means reload every second. This is the default value in a development environment.
Values specified for this parameter using the Admin Console are given precedence.
native-io-enabled
To use native I/O while serving static files with weblogic.servlet.FileServlet, which is implicitly registered as the default servlet, set native-io-enabled to true. (The default value is false.) native-io-enabled element applies only on Windows.
<jsp-descriptor>
page-check-seconds
Sets the interval, in seconds, at which WebLogic Server checks to see if JSP files have changed and need recompiling. Dependencies are also checked and recursively reloaded if changed.
-
The value -1 means never check the pages. This is the default value in a production environment.
-
The value 0 means always check the pages.
-
The value 1 means check the pages every second. This is the default value in a development environment.
In a production environment where changes to a JSP are rare, consider changing the value of pageCheckSeconds to 60 or greater, according to your tuning requirements.
-
设置Initial Capacity等于Maximum Capacity
-
设置Statement cache(注意,对于每个打开的statement,DBMS都会维护一个cursor,这个值设置过大会导致 java.sql.SQLException: ORA-01000: maximum open cursors exceeded类似的错误。当然,你要清楚,statement cache的大小是指每个连接能cache的statement数,例如你设置connection pool size = 100 ,设置Statement Cache = 10,那系统最大维持的cursor为100*10)
-
使用productmode启动weblogic
-
设置-xms等于-xmx
-
尽量使用jrockit
del.icio.us Tags:
weblogic ,
tuning ,
tips
摘要: 作者:tacy.lee
一个简单的java io测试,不同的实现对比看一个zip包的解压速度
阅读全文